Facebook
 X
X
 Pinterest
 Copy Link


This video is the latest in our Monday with Matthew series with Windermere Chief Economist Matthew Gardner. Each month, he analyzes the most up-to-date U.S. housing data to keep you well-informed about what’s going on in the real estate market.
Hello there, I’m Windermere’s Real Estate’s Chief Economist Matthew Gardner and welcome to the first episode of “Monday with Matthew” for 2023. As has become tradition, this first episode of the year will be dedicated to my real estate forecast for the U.S. housing market, so let’s get straight to it.
2023 Real Estate Forecast
Existing Home Sales & Forecast
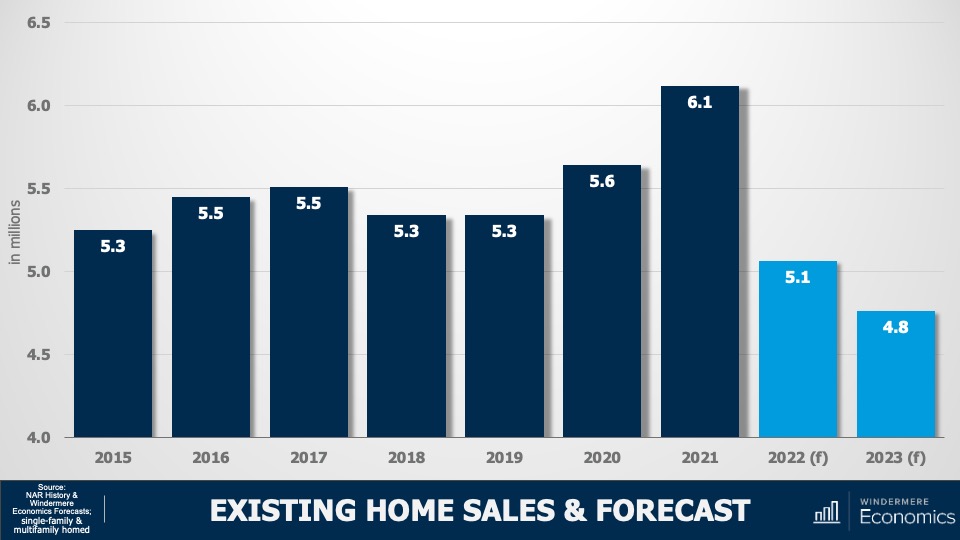
Image Source: Matthew Gardner
U.S. home sales trended lower through all of 2022 and, although I believe that sales will still have held above five million, this certainly won’t be the case in 2023. Affordability and higher financing costs will continue to act as headwinds when it comes to sales, but I think that the bigger issue will be that listing activity will not rise significantly as we move through the year.
As I have been saying for several months now, I don’t see why many households who don’t have to move will move and lose the historically low interest rate that they currently benefit from. That said, sales will still occur this year but at just 4.8 million, sales will be lower than we have seen since 2014.
Annual Change in Median Sale Prices
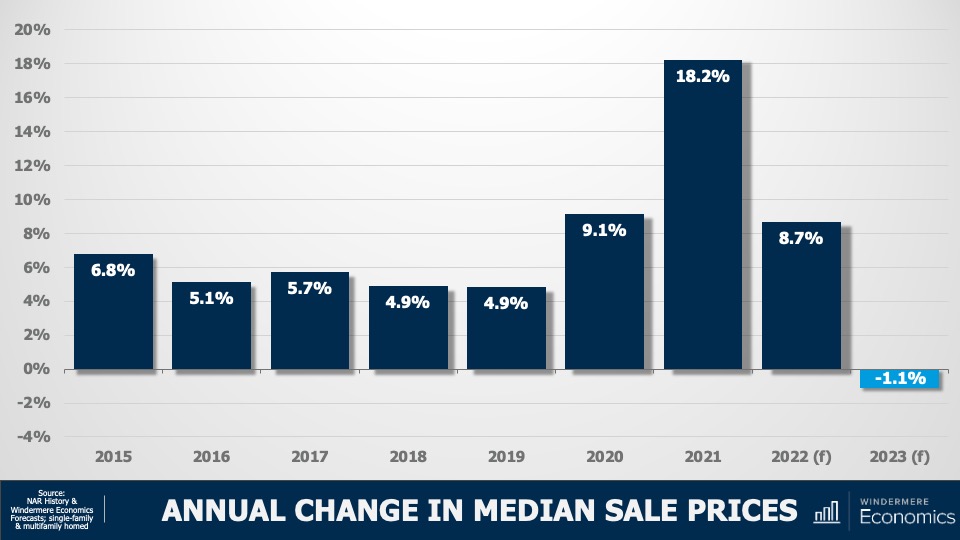
Image Source: Matthew Gardner
Much has been said about the future of home prices, with some forecasters even suggesting that housing prices will collapse in a similar fashion to that seen following the bursting of the housing bubble back in 2008. Now, although price growth through the pandemic period was clearly excessive, fundamentally speaking, the two periods cannot be considered to be similar at all.
It’s my opinion that sale prices in 2023 will be very modestly lower than last year and I certainly don’t expect to see a collapse in home values.
But not all markets are created equal. The pandemic created what has become known as “Zoom-Towns.” These were cheap markets that affluent buyers flocked to because of their newly found ability to work from home and this led sale prices there to soar. It’s these locations that will likely see prices fall more significantly. Ultimately, expect to see prices fall through the first half of this year before starting to recover in the second half.
New Home Starts & Forecast (Single Family)
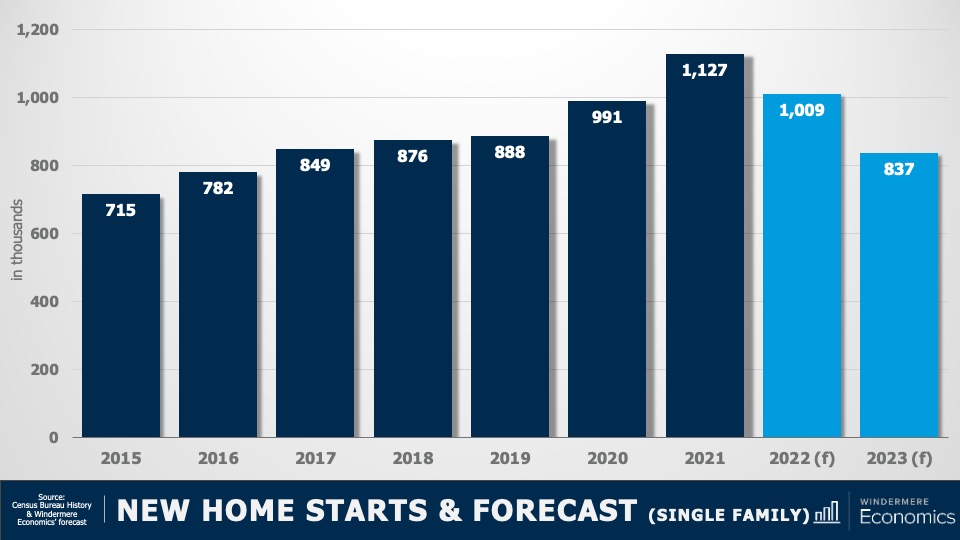
Image Source: Matthew Gardner
Looking now at the new construction market, housing starts fell last year as construction costs remained high and mortgage rates rose which lowered demand. And I’m afraid that I do not see 2023 as being one where builders will deliver more inventory, with starts pulling back to a level the country hasn’t seen since 2016. That said, I am expecting a recovery in 2024 when new home starts will break back above the 1,000,000 level.
New Home Sales Forecast
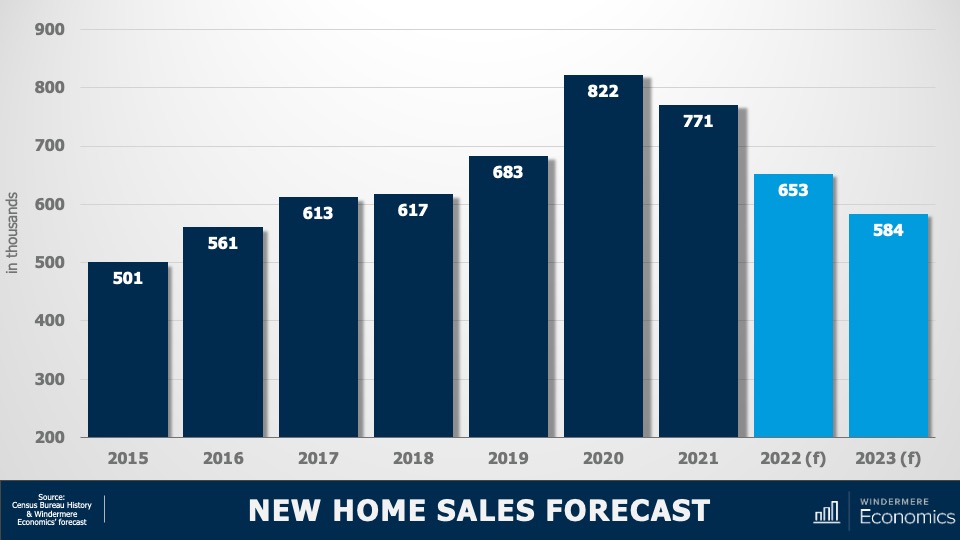
Image Source: Matthew Gardner
New home sales in 2023 will fall further coming in below 600,000 but there is some light at the end of the tunnel with sales picking up fairly significantly again in 2024. We all understand that the country has a significant undersupply of ownership housing, but the costs associated with building new homes is still making it remarkably hard for builders even though they understand that demand will be significant for at least the next decade and a half given current demographics.
But the problem they will continue to face is that demand will primarily come from entry level buyers and, simply put, the cost to build a home precludes many developers from being able to meet this demand.
Average 30-Year Mortgage Rate & Forecast
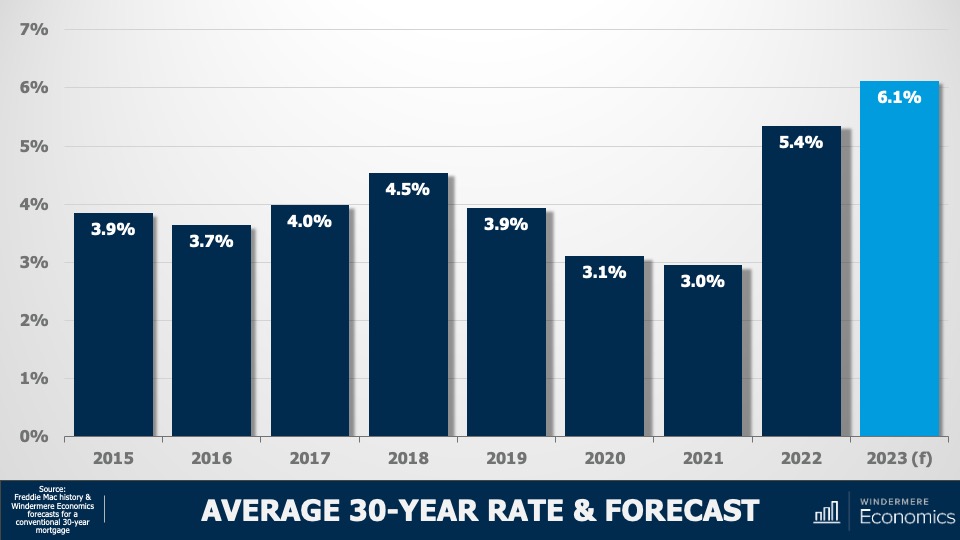
Image Source: Matthew Gardner
And finally, my forecast for mortgage rates in 2023. Although this might not look good at all, as they say, “the devil is in the details.” Rates skyrocketed last year as the Fed stopped buying treasuries and mortgage-backed securities and, although they are off the highs we saw toward the end of last year, they are still significantly higher today than the market has become used to seeing.
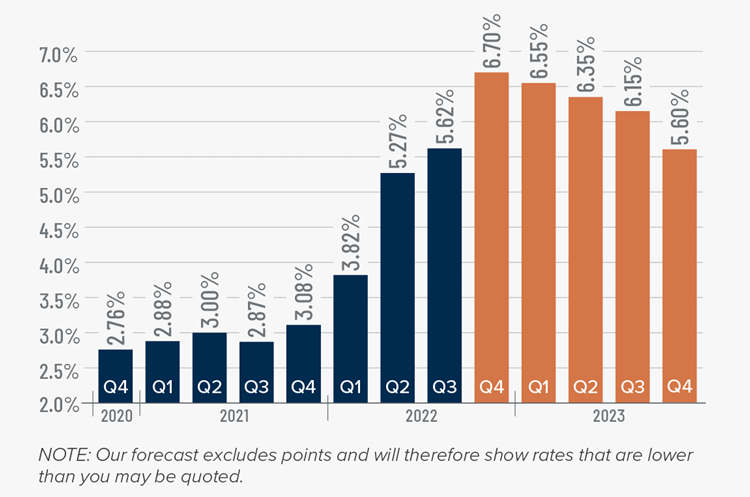
As you can see here, I’m anticipating the average 30-year conventional rate to average 6.1% in 2023, but my forecast is actually a bit better than this shows.
Average 30-Year Mortgage Rate Forecast 2023
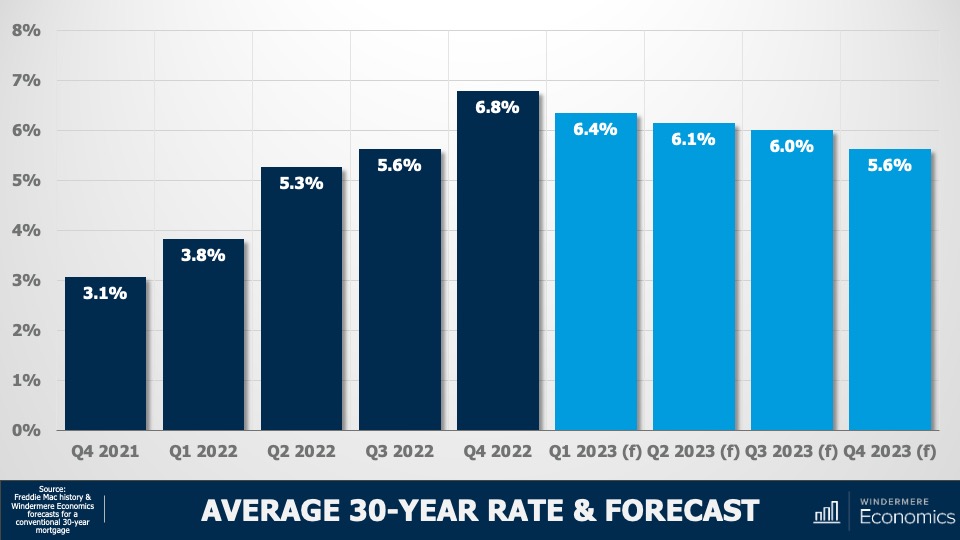
Image Source: Matthew Gardner
You see, my quarterly forecast suggests that rates have actually already peaked, and that they will trend lower as we move through this year and break below 6% by the fourth quarter. I would add that if anything my forecast may be a little pessimistic, and rates may end 2023 a little lower than I am showing here.
But that will depend on the Fed, and how long they will continue raising rates, and how long it will take before they start to lower them if the US enters a recession this year, which many forecasters including myself believe will be the case.
So, there you have it, my 2023 U.S. housing forecast. I will leave you with this one last thought. 2023 will be a transition year when the housing market will come off the “high” we saw during the pandemic and borrowing costs were artificially low.
I don’t see any reason for buyers or sellers to panic though. By the end of 2023, most markets will have corrected themselves and I believe we will see prices and demand start to pick up again toward the end of this year, but at a far more normalized pace.
As always, I look forward to your comments on my forecasts and I’ll see you all again next month. Take care now.
About Matthew Gardner
As Chief Economist for Windermere Real Estate, Matthew Gardner is responsible for analyzing and interpreting economic data and its impact on the real estate market on both a local and national level. Matthew has over 30 years of professional experience both in the U.S. and U.K.
In addition to his day-to-day responsibilities, Matthew sits on the Washington State Governors Council of Economic Advisors; chairs the Board of Trustees at the Washington Center for Real Estate Research at the University of Washington; and is an Advisory Board Member at the Runstad Center for Real Estate Studies at the University of Washington where he also lectures in real estate economics.