Facebook
 X
X
 Pinterest
 Copy Link


The following analysis of select counties of the Western Washington real estate market is provided by Windermere Real Estate Chief Economist Matthew Gardner. We hope that this information may assist you with making better-informed real estate decisions. For further information about the housing market in your area, please don’t hesitate to contact your Windermere Real Estate agent.
Regional Economic Overview
The pace of employment growth in Western Washington continues to slow. The region added only 90,340 new jobs over the past 12 months. That said, the annual pace of employment growth was a respectable 3.6%. Three counties have not recovered completely from their pandemic job losses: Whatcom, Skagit, and Snohomish. However they are short by just under 10,000 jobs, which should be recovered by this fall. Regionally, the unemployment rate in February was 4.1%, which was marginally above the 3.8% level of a year ago. The employment outlook has improved modestly, with the likelihood of a recession in 2023 down to about 50%. That said, I expect the pace of job growth to continue to slow as businesses remain concerned about a contraction in consumer spending, as well as facing tighter credit conditions following recent bank failures.
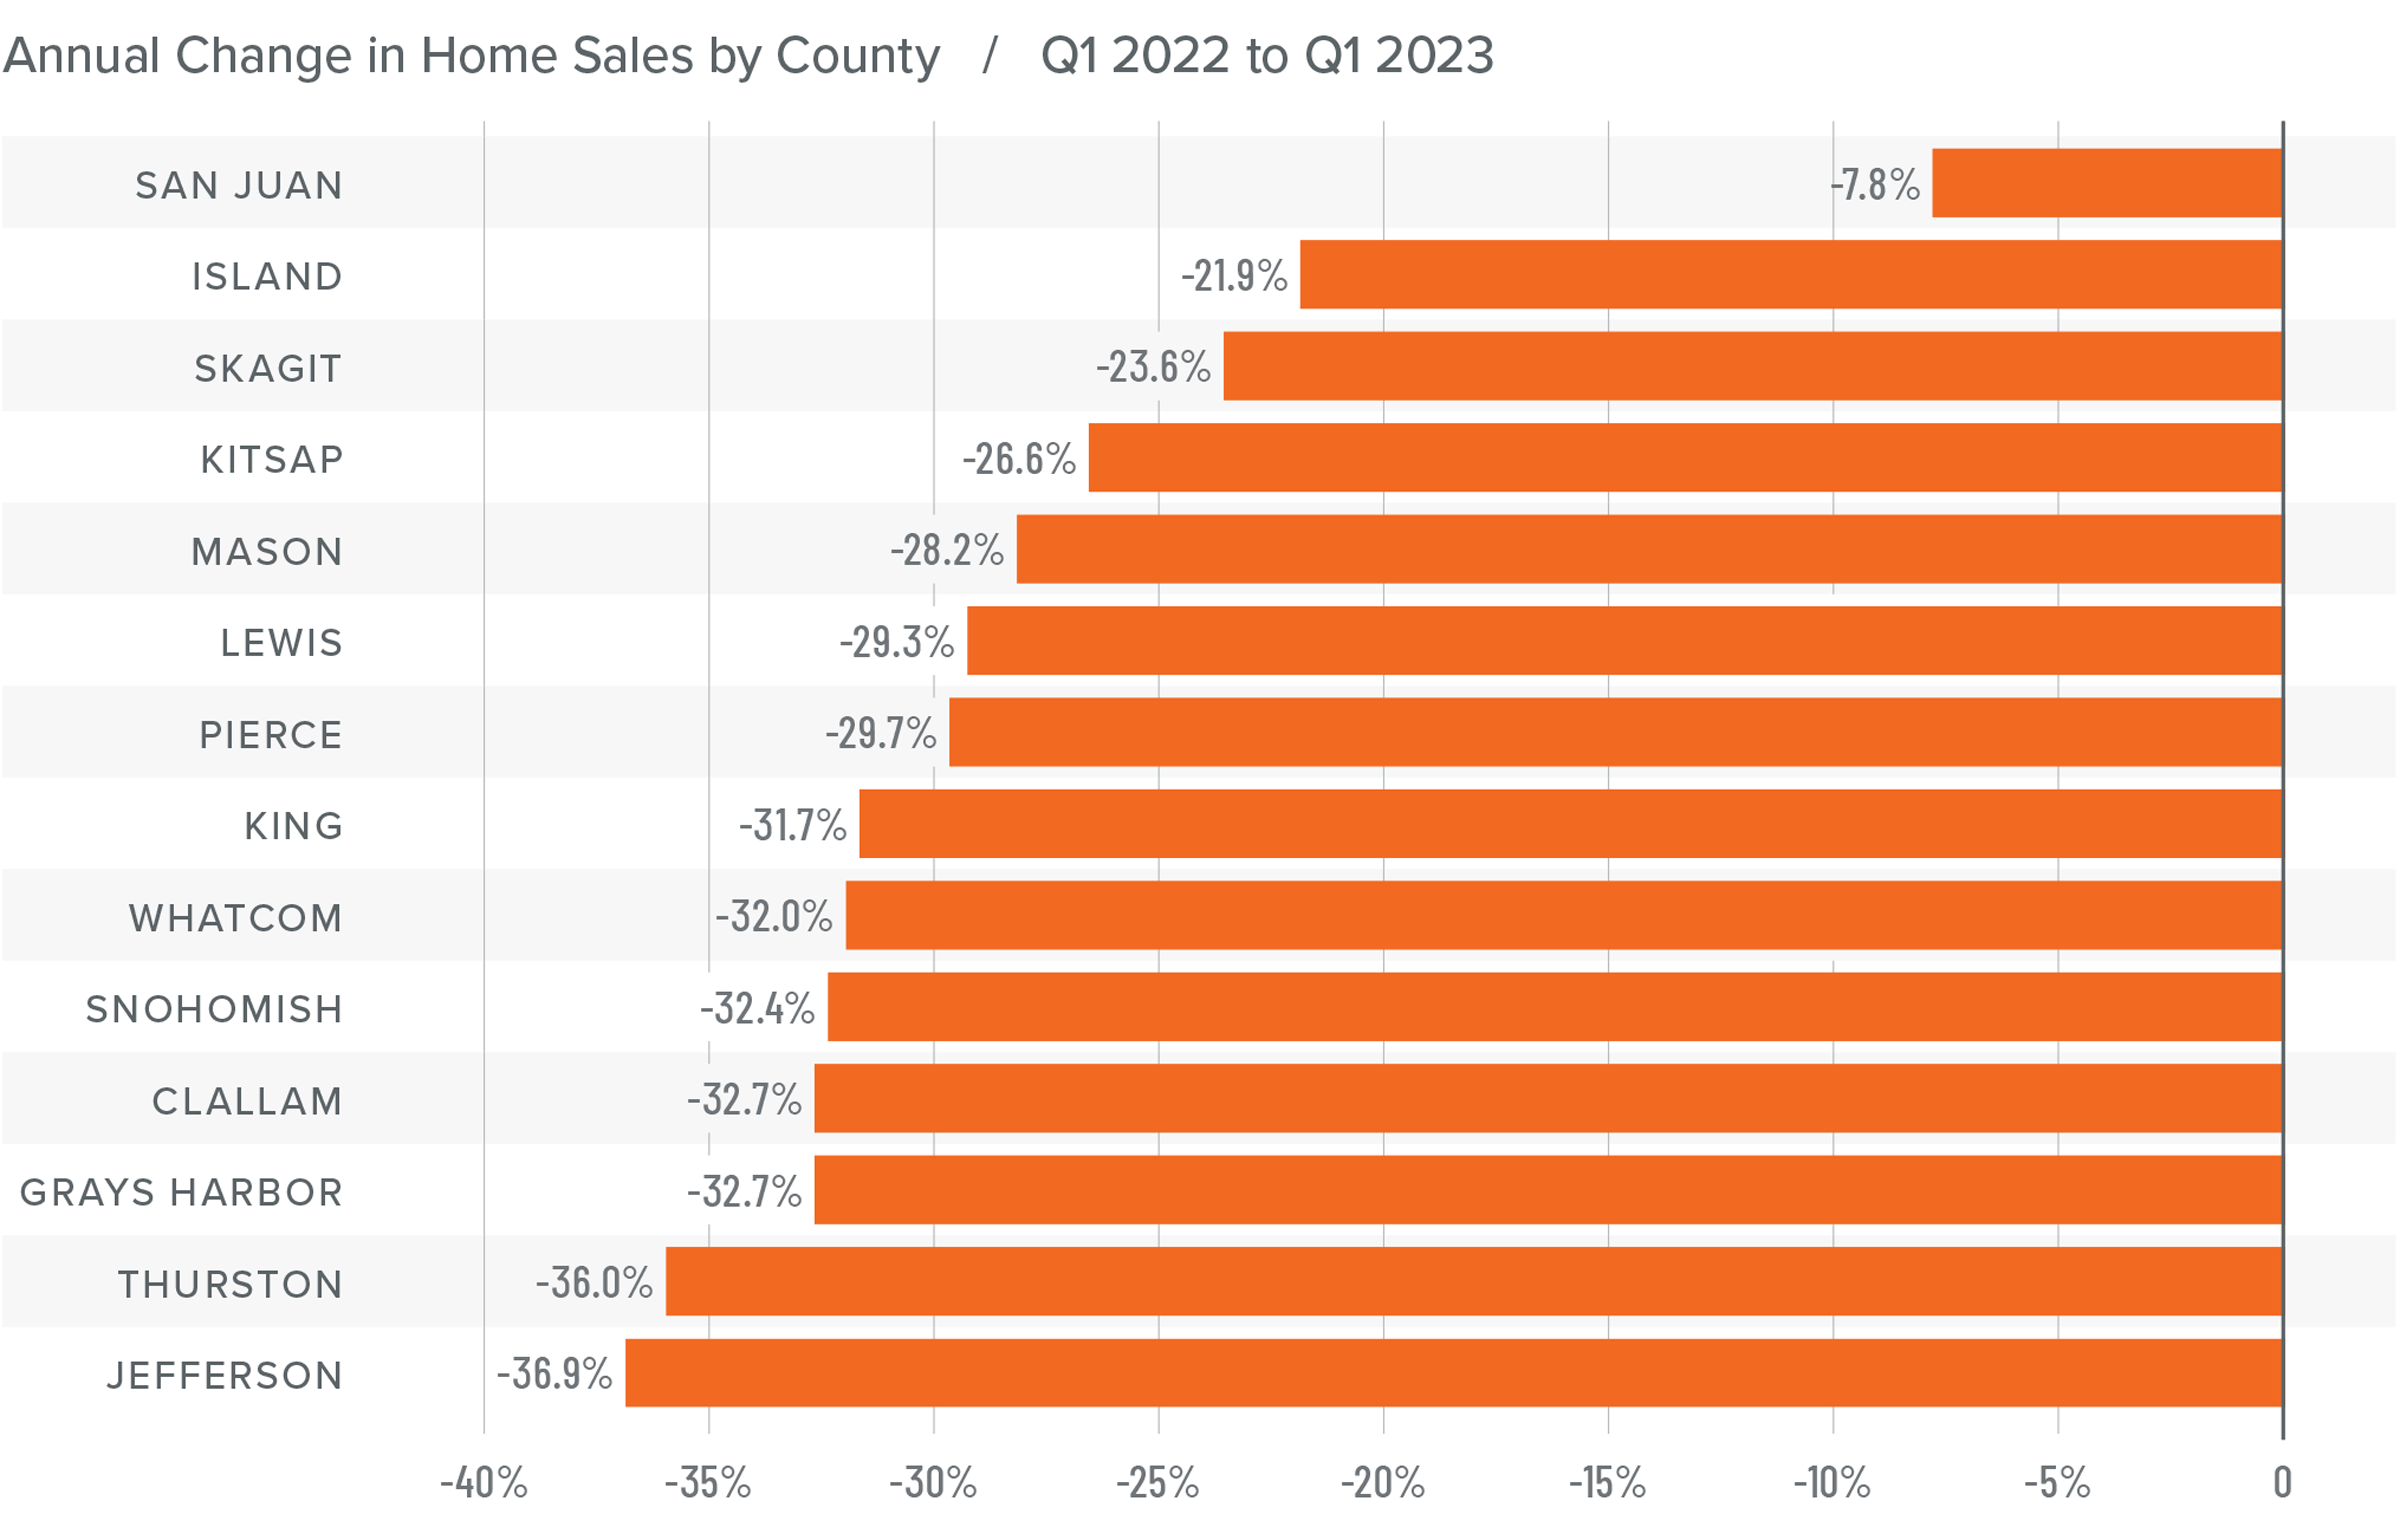
Western Washington Home Sales
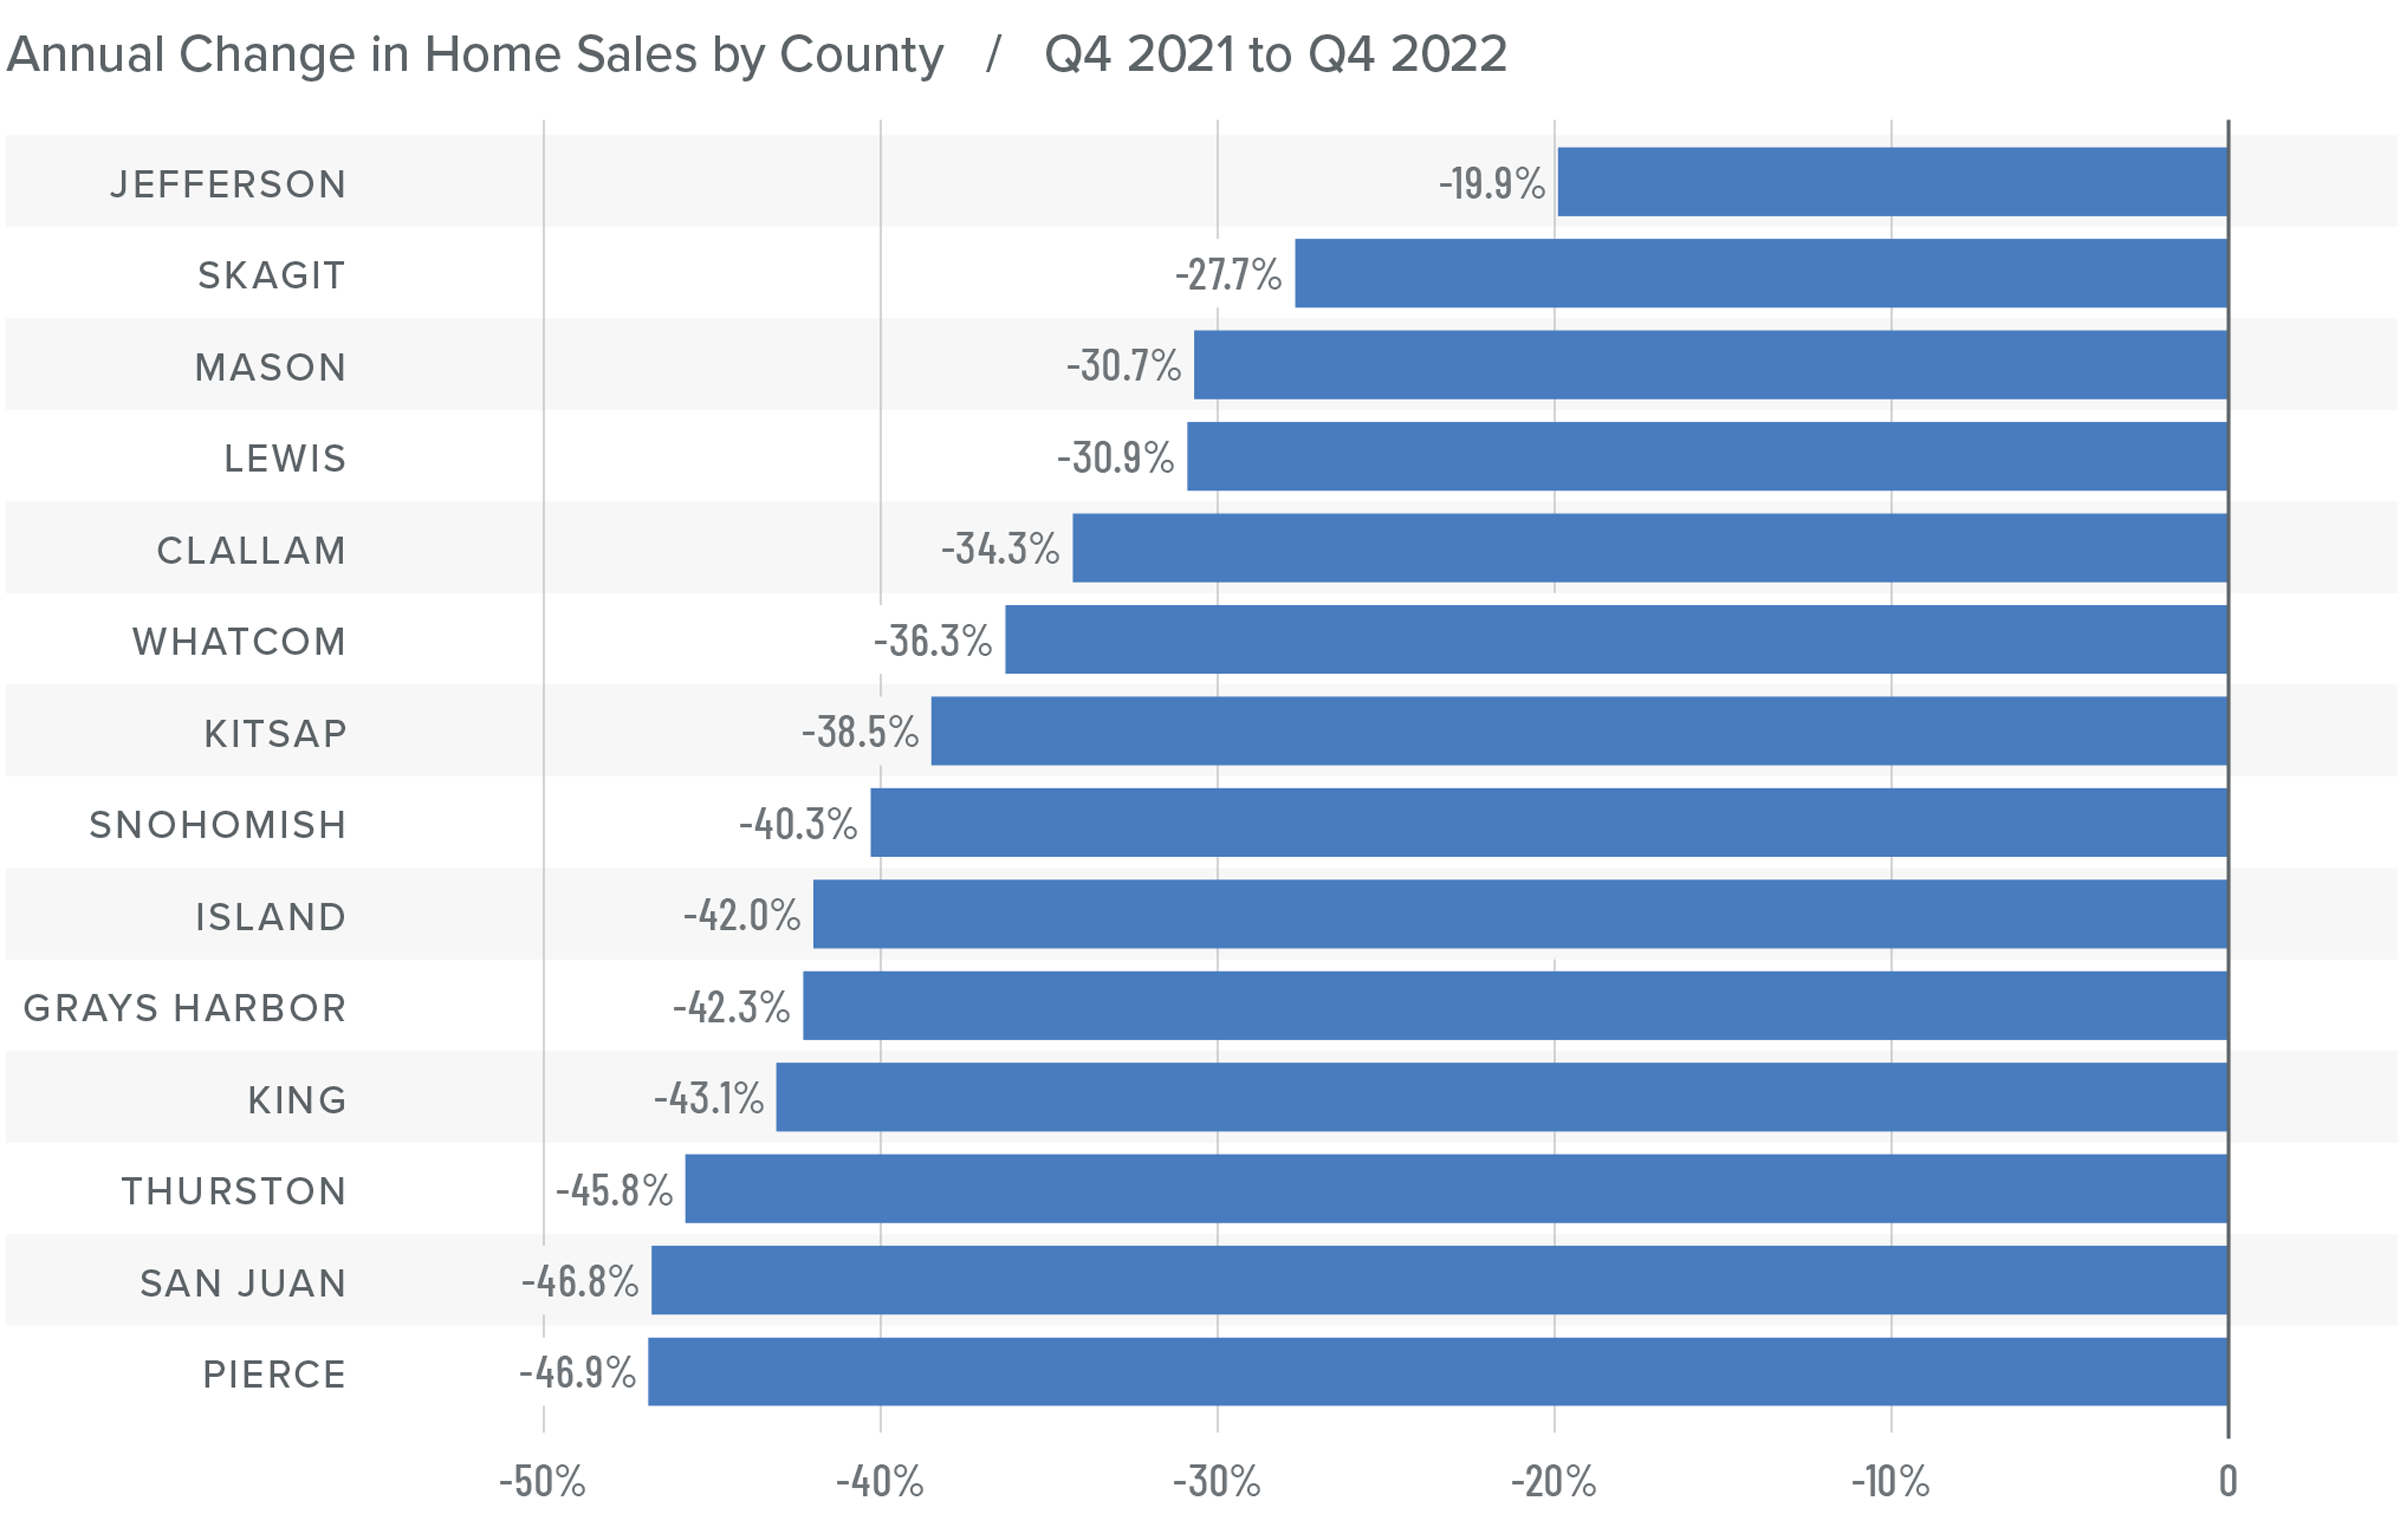
❱ In the first quarter of the year, 10,335 homes sold. This was down 30.9% from the same period in 2022 and 18.9% lower than in the fourth quarter of 2022.
❱ Lower sales activity was more a function of the limited number of homes for sale than anything else. Listing activity in the first quarter of 2023 was down 43% from the final quarter of 2022.
❱ Home sales fell across the board compared to the same quarter of last year and were lower in every county compared to the final quarter of 2022.
❱ Pending sales rose in all but three counties compared to the fourth quarter of 2022. This suggests that sales in the second quarter of the year may tick higher. That said, the region is in dire need of more inventory.
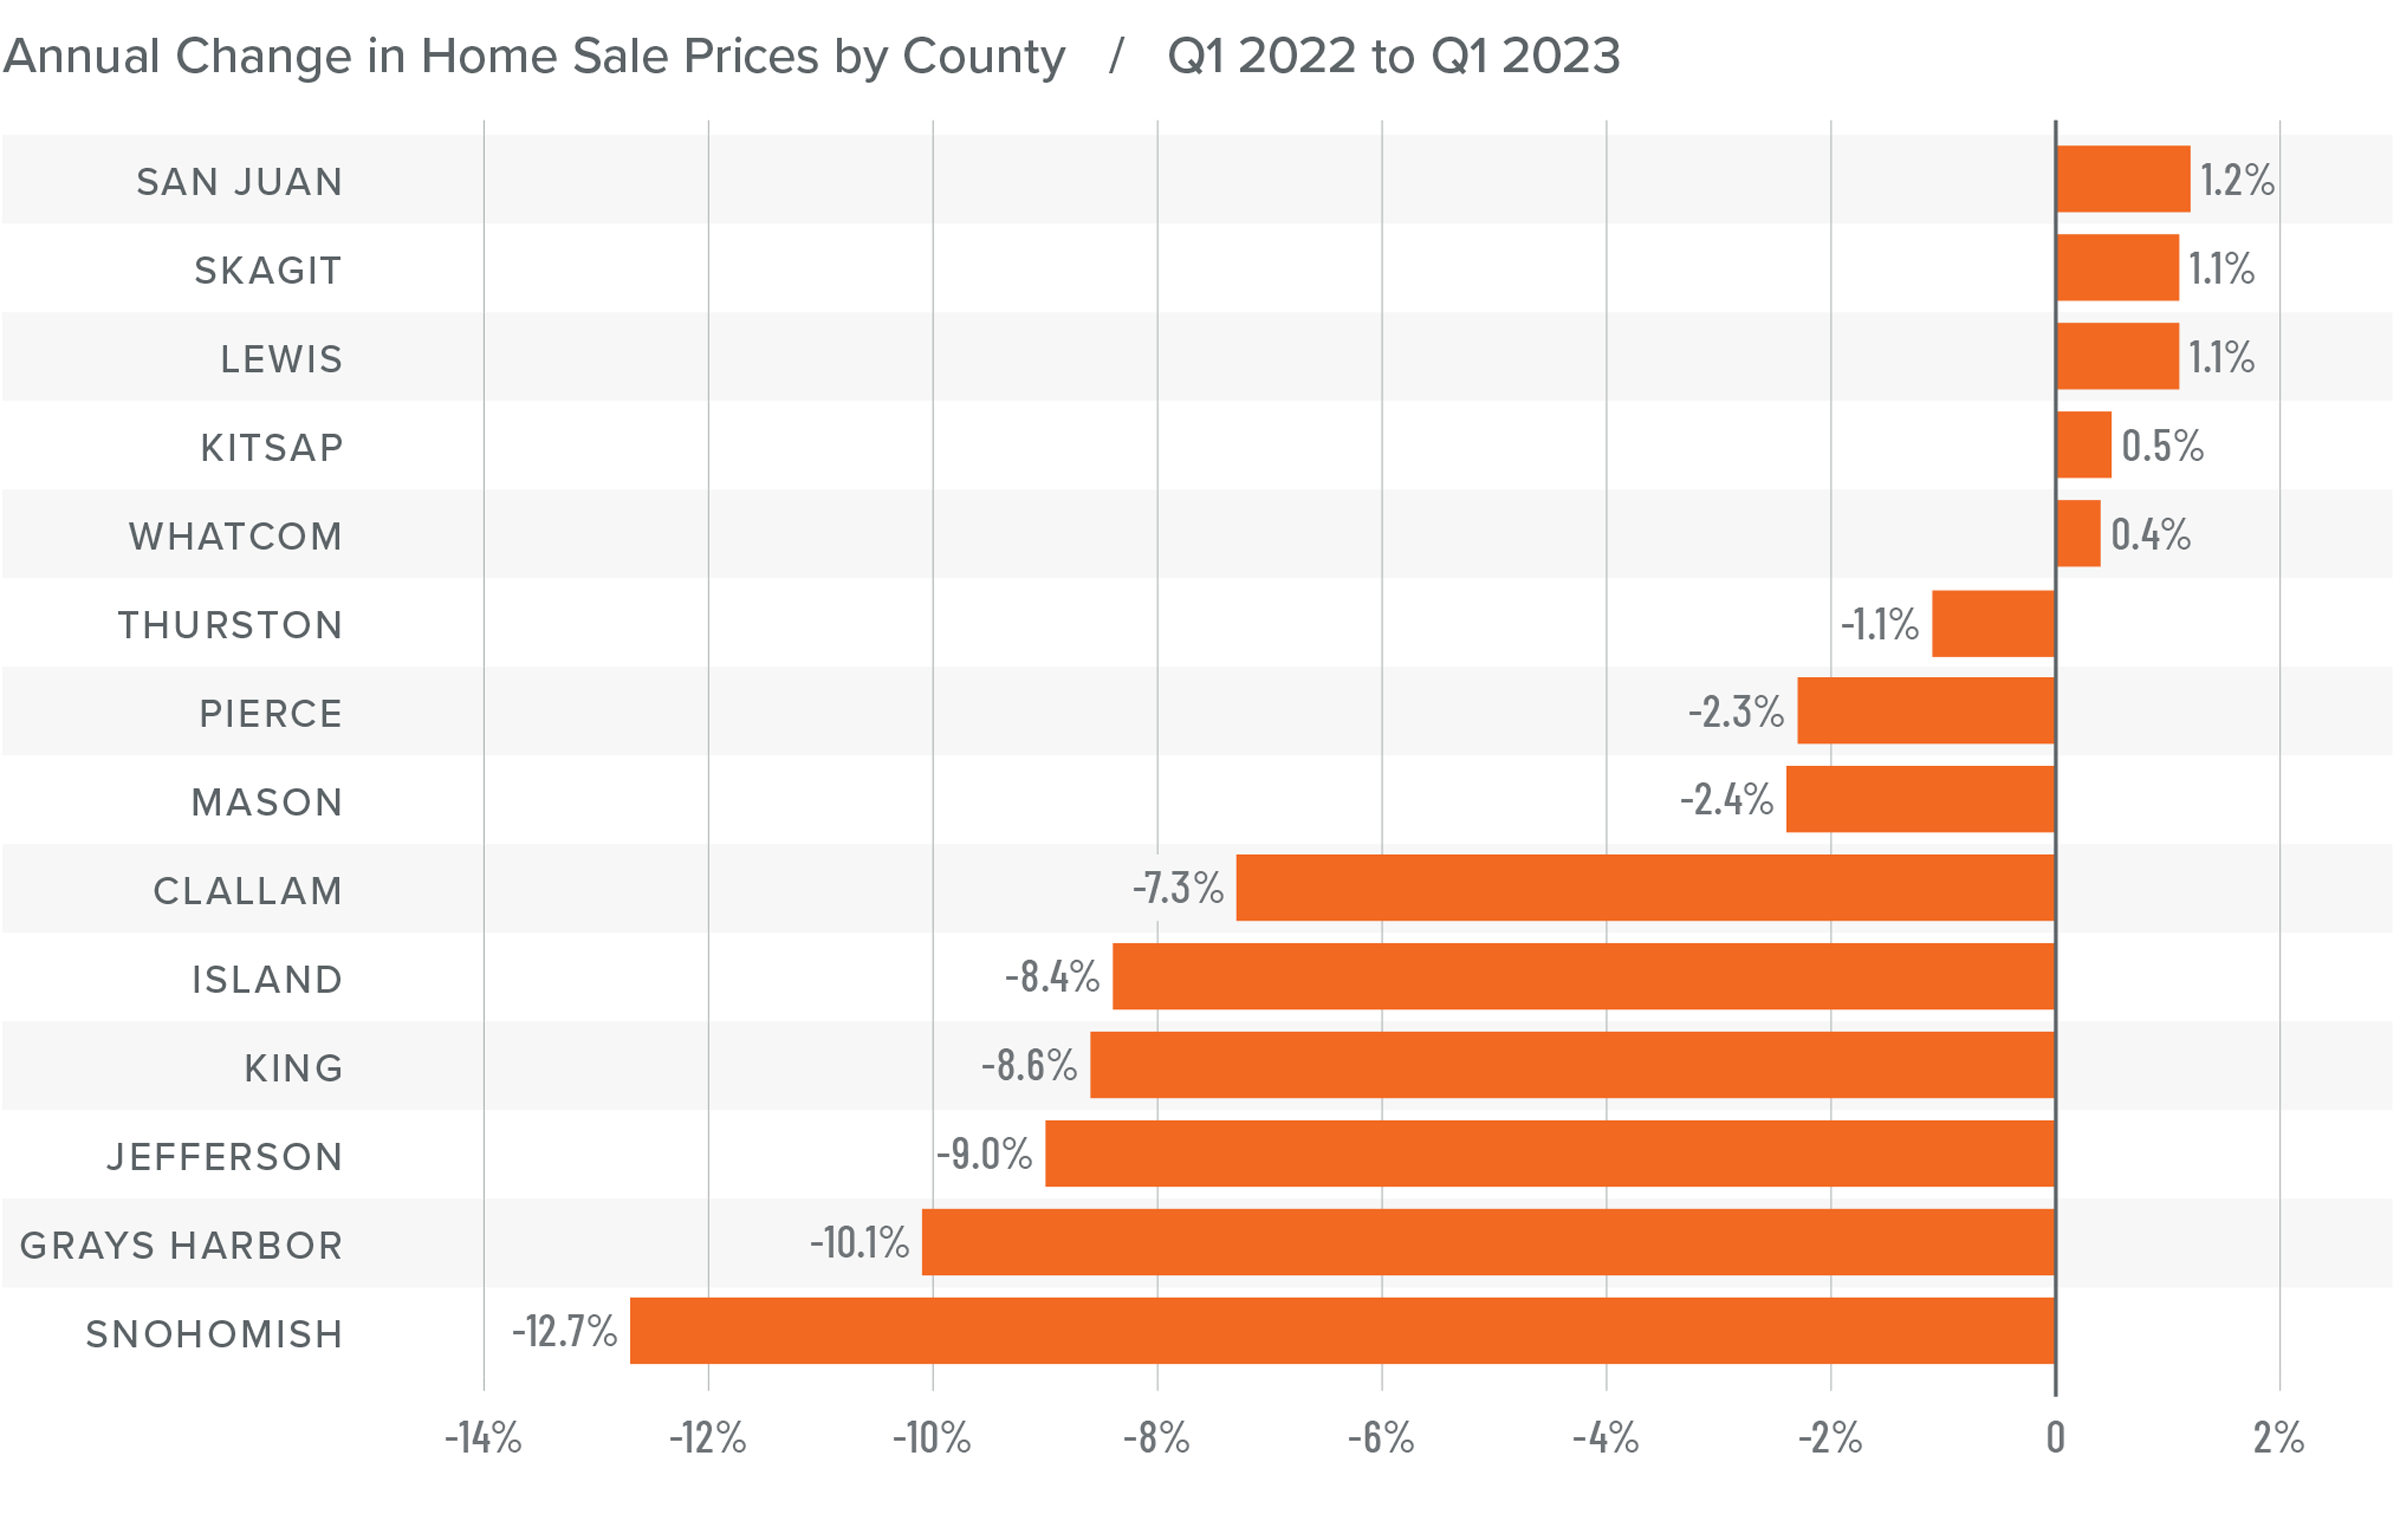
Western Washington Home Prices
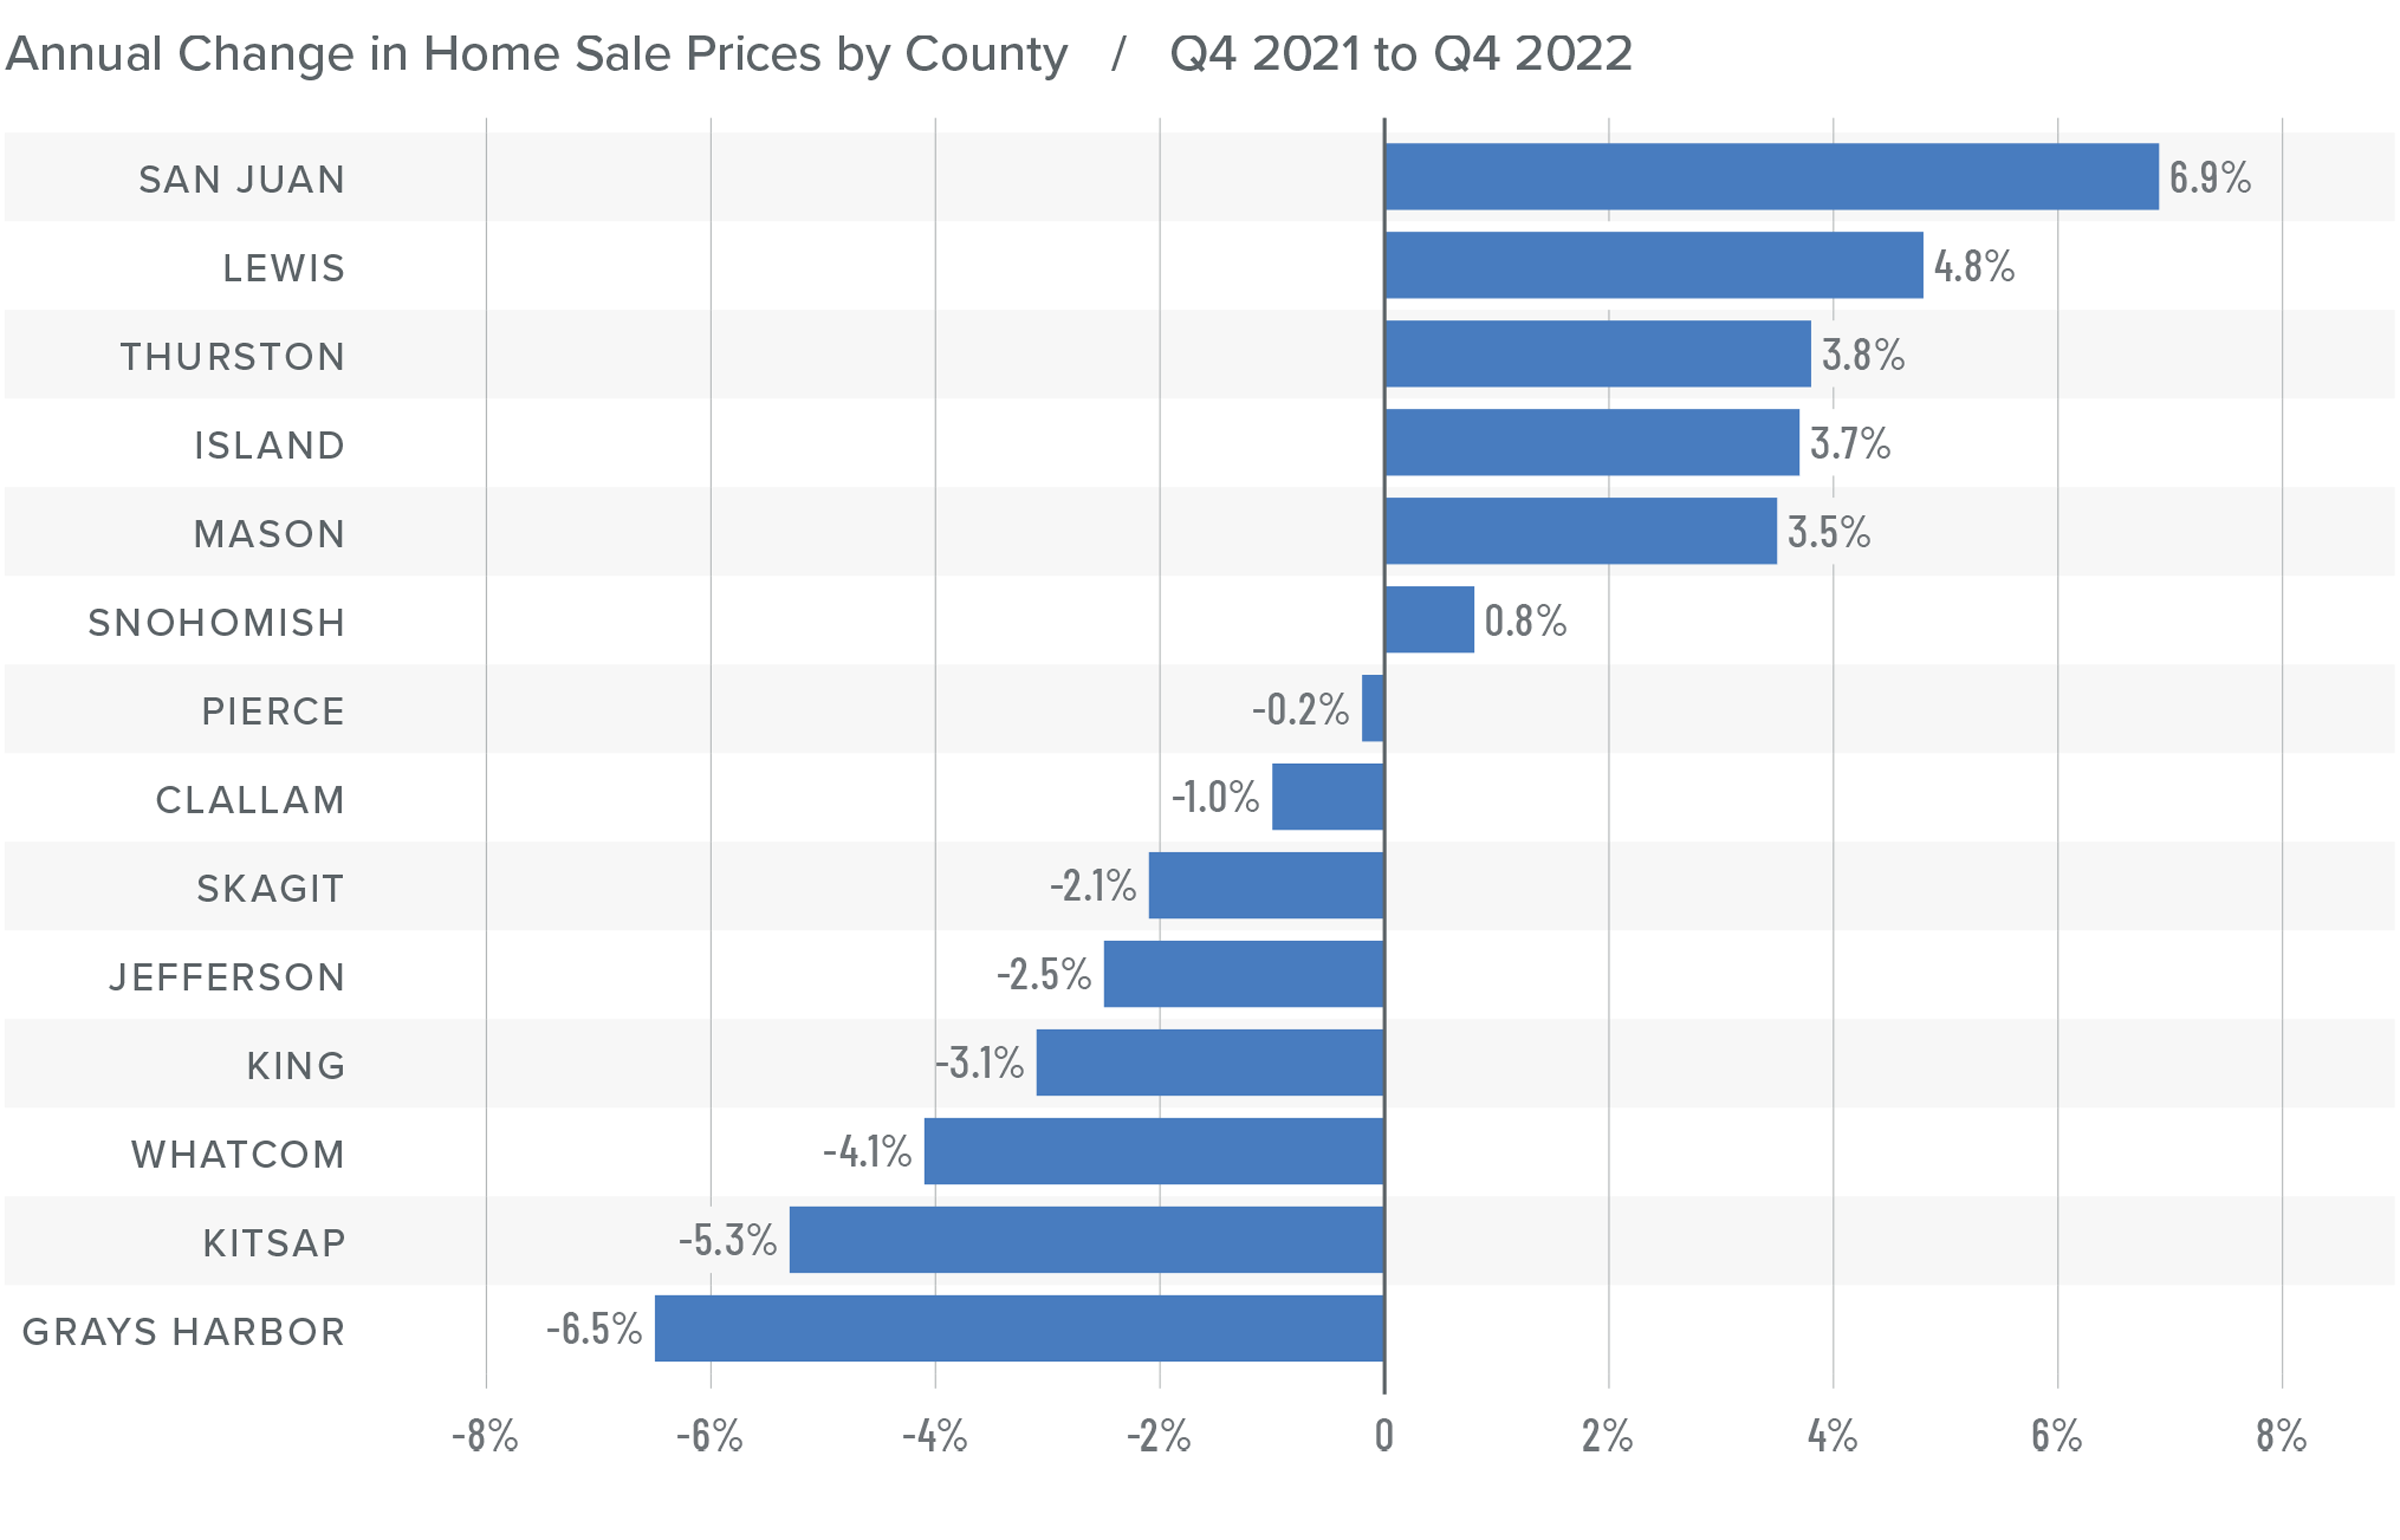
❱ Home prices fell an average of 6.9% compared to the first quarter of 2022 and were 1.3% lower than in the fourth quarter of 2022. The average home sale price in the first quarter of 2023 was $692,866.
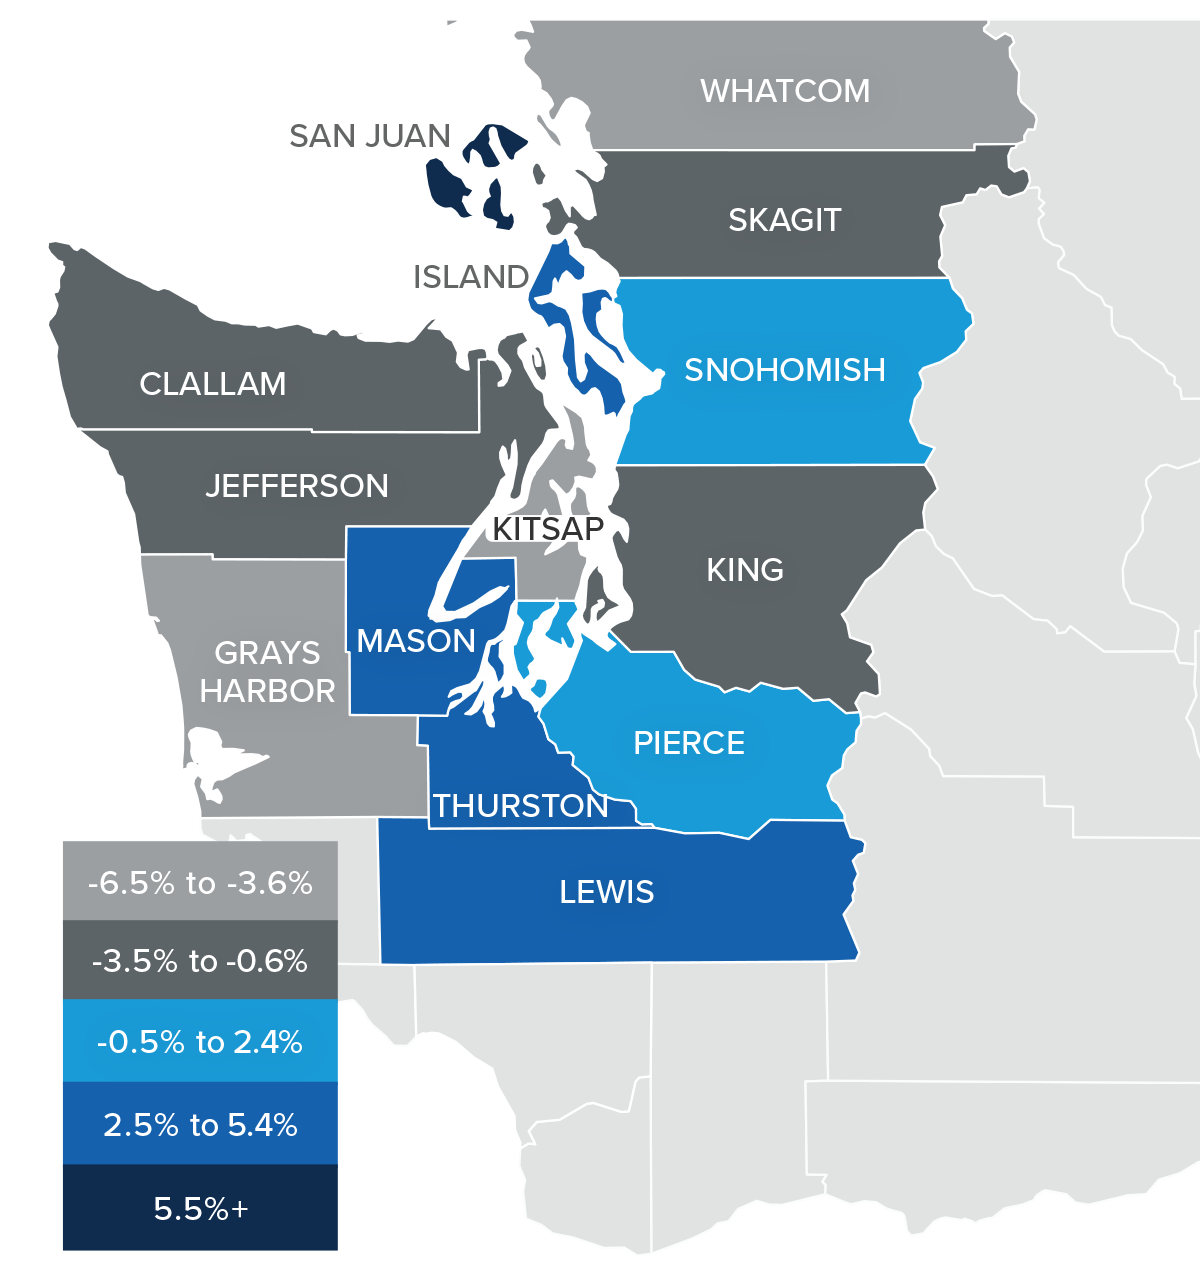
❱ Compared to the fourth quarter of 2022, prices were higher in Kitsap, Skagit, Lewis, San Juan, and Whatcom counties.
❱ Even though prices fell in the region, five counties saw sale prices rise very modestly from the first quarter of 2023.
❱ It’s worth noting that median listing prices rose in all but two markets compared to the previous quarter. This suggests that sellers are getting a little more comfortable with the market. If listing prices continue to rise, one can surmise that home prices will follow suit.

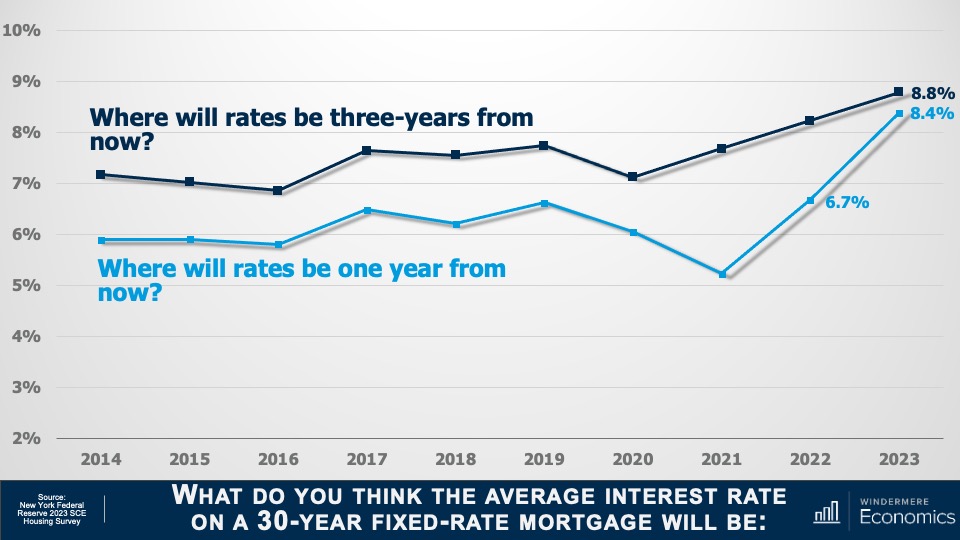
Mortgage Rates
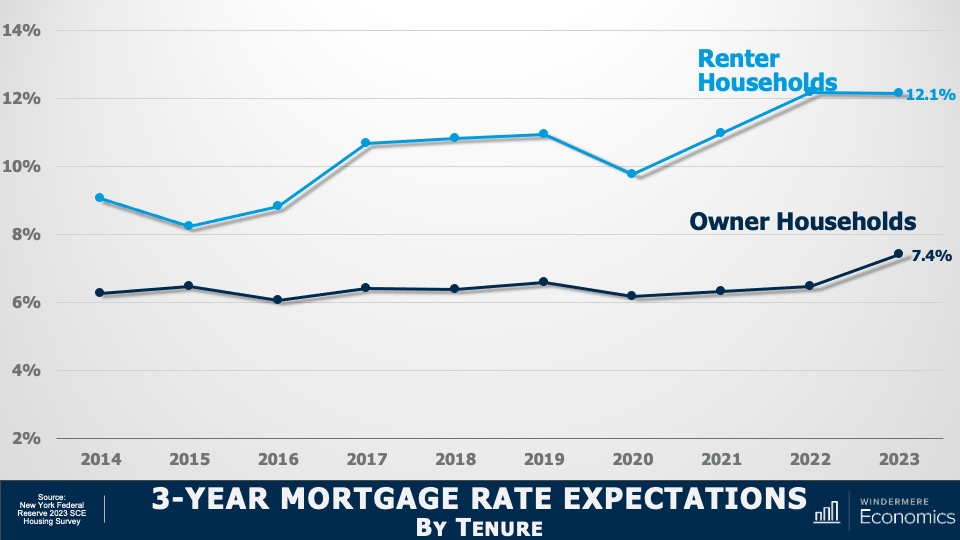
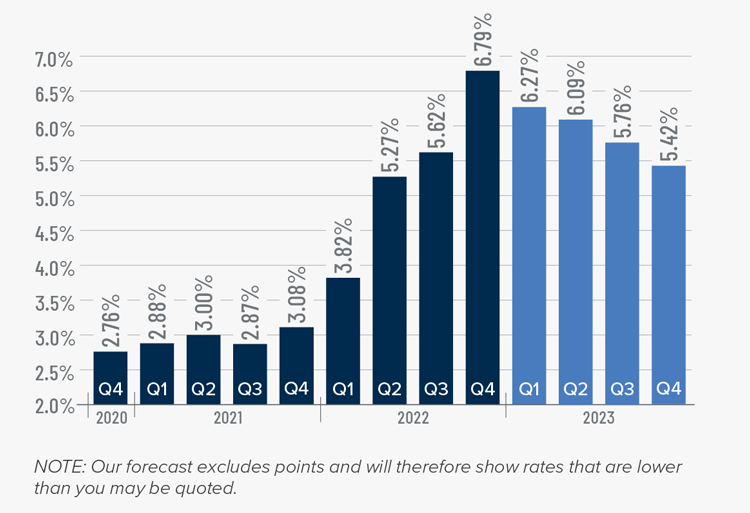
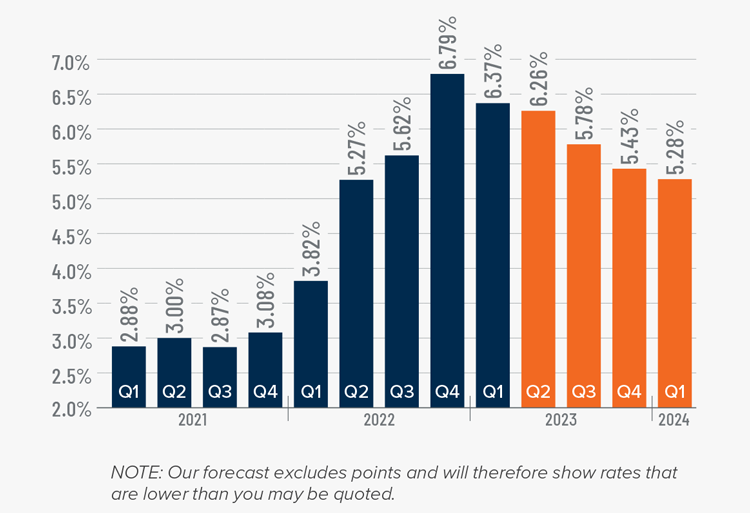
Rates in the first quarter of 2023 were far less volatile than last year, even with the brief but significant impact of early March’s banking crisis. It appears that buyers are jumping in when rates dip, which was the case in mid-January and again in early February.
Even with the March Consumer Price Index report showing inflation slowing, I still expect the Federal Reserve to raise short-term rates one more time following their May meeting before pausing rate increases. This should be the catalyst that allows mortgage rates to start trending lower at a more consistent pace than we have seen so far this year. My current forecast is that rates will continue to move lower with occasional spikes, and that they will hold below 6% in the second half of this year.
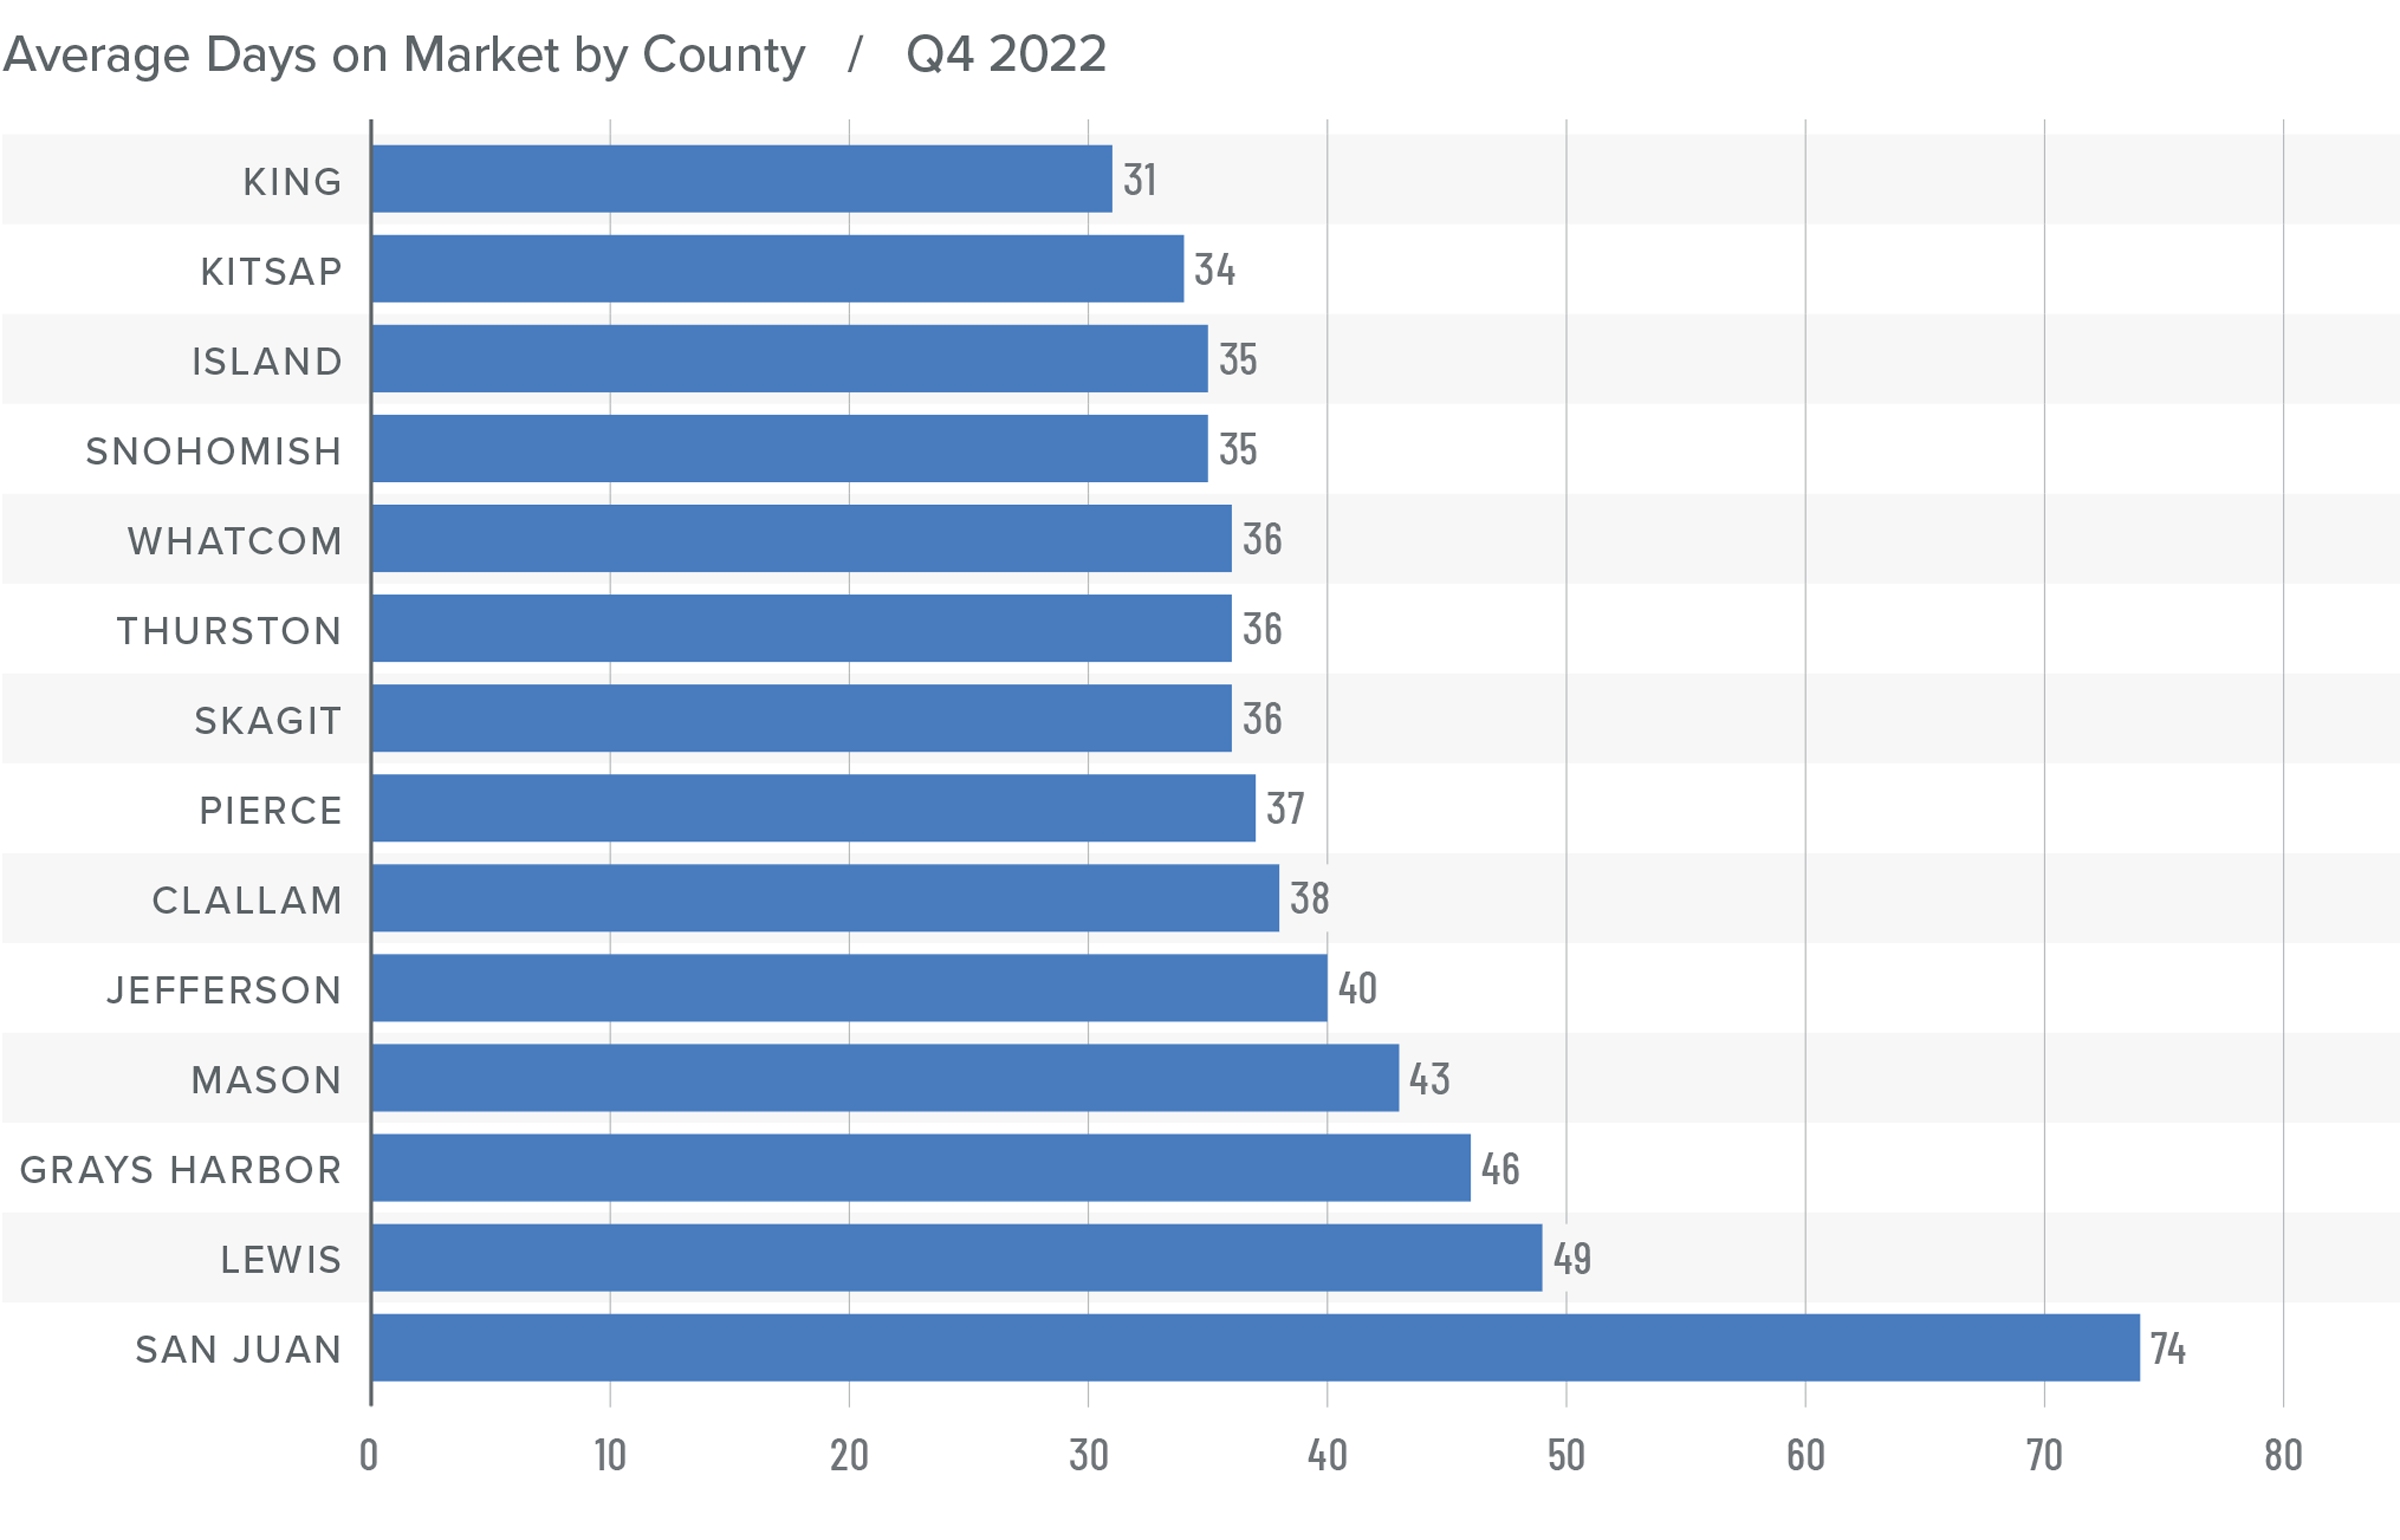
Western Washington Days on Market
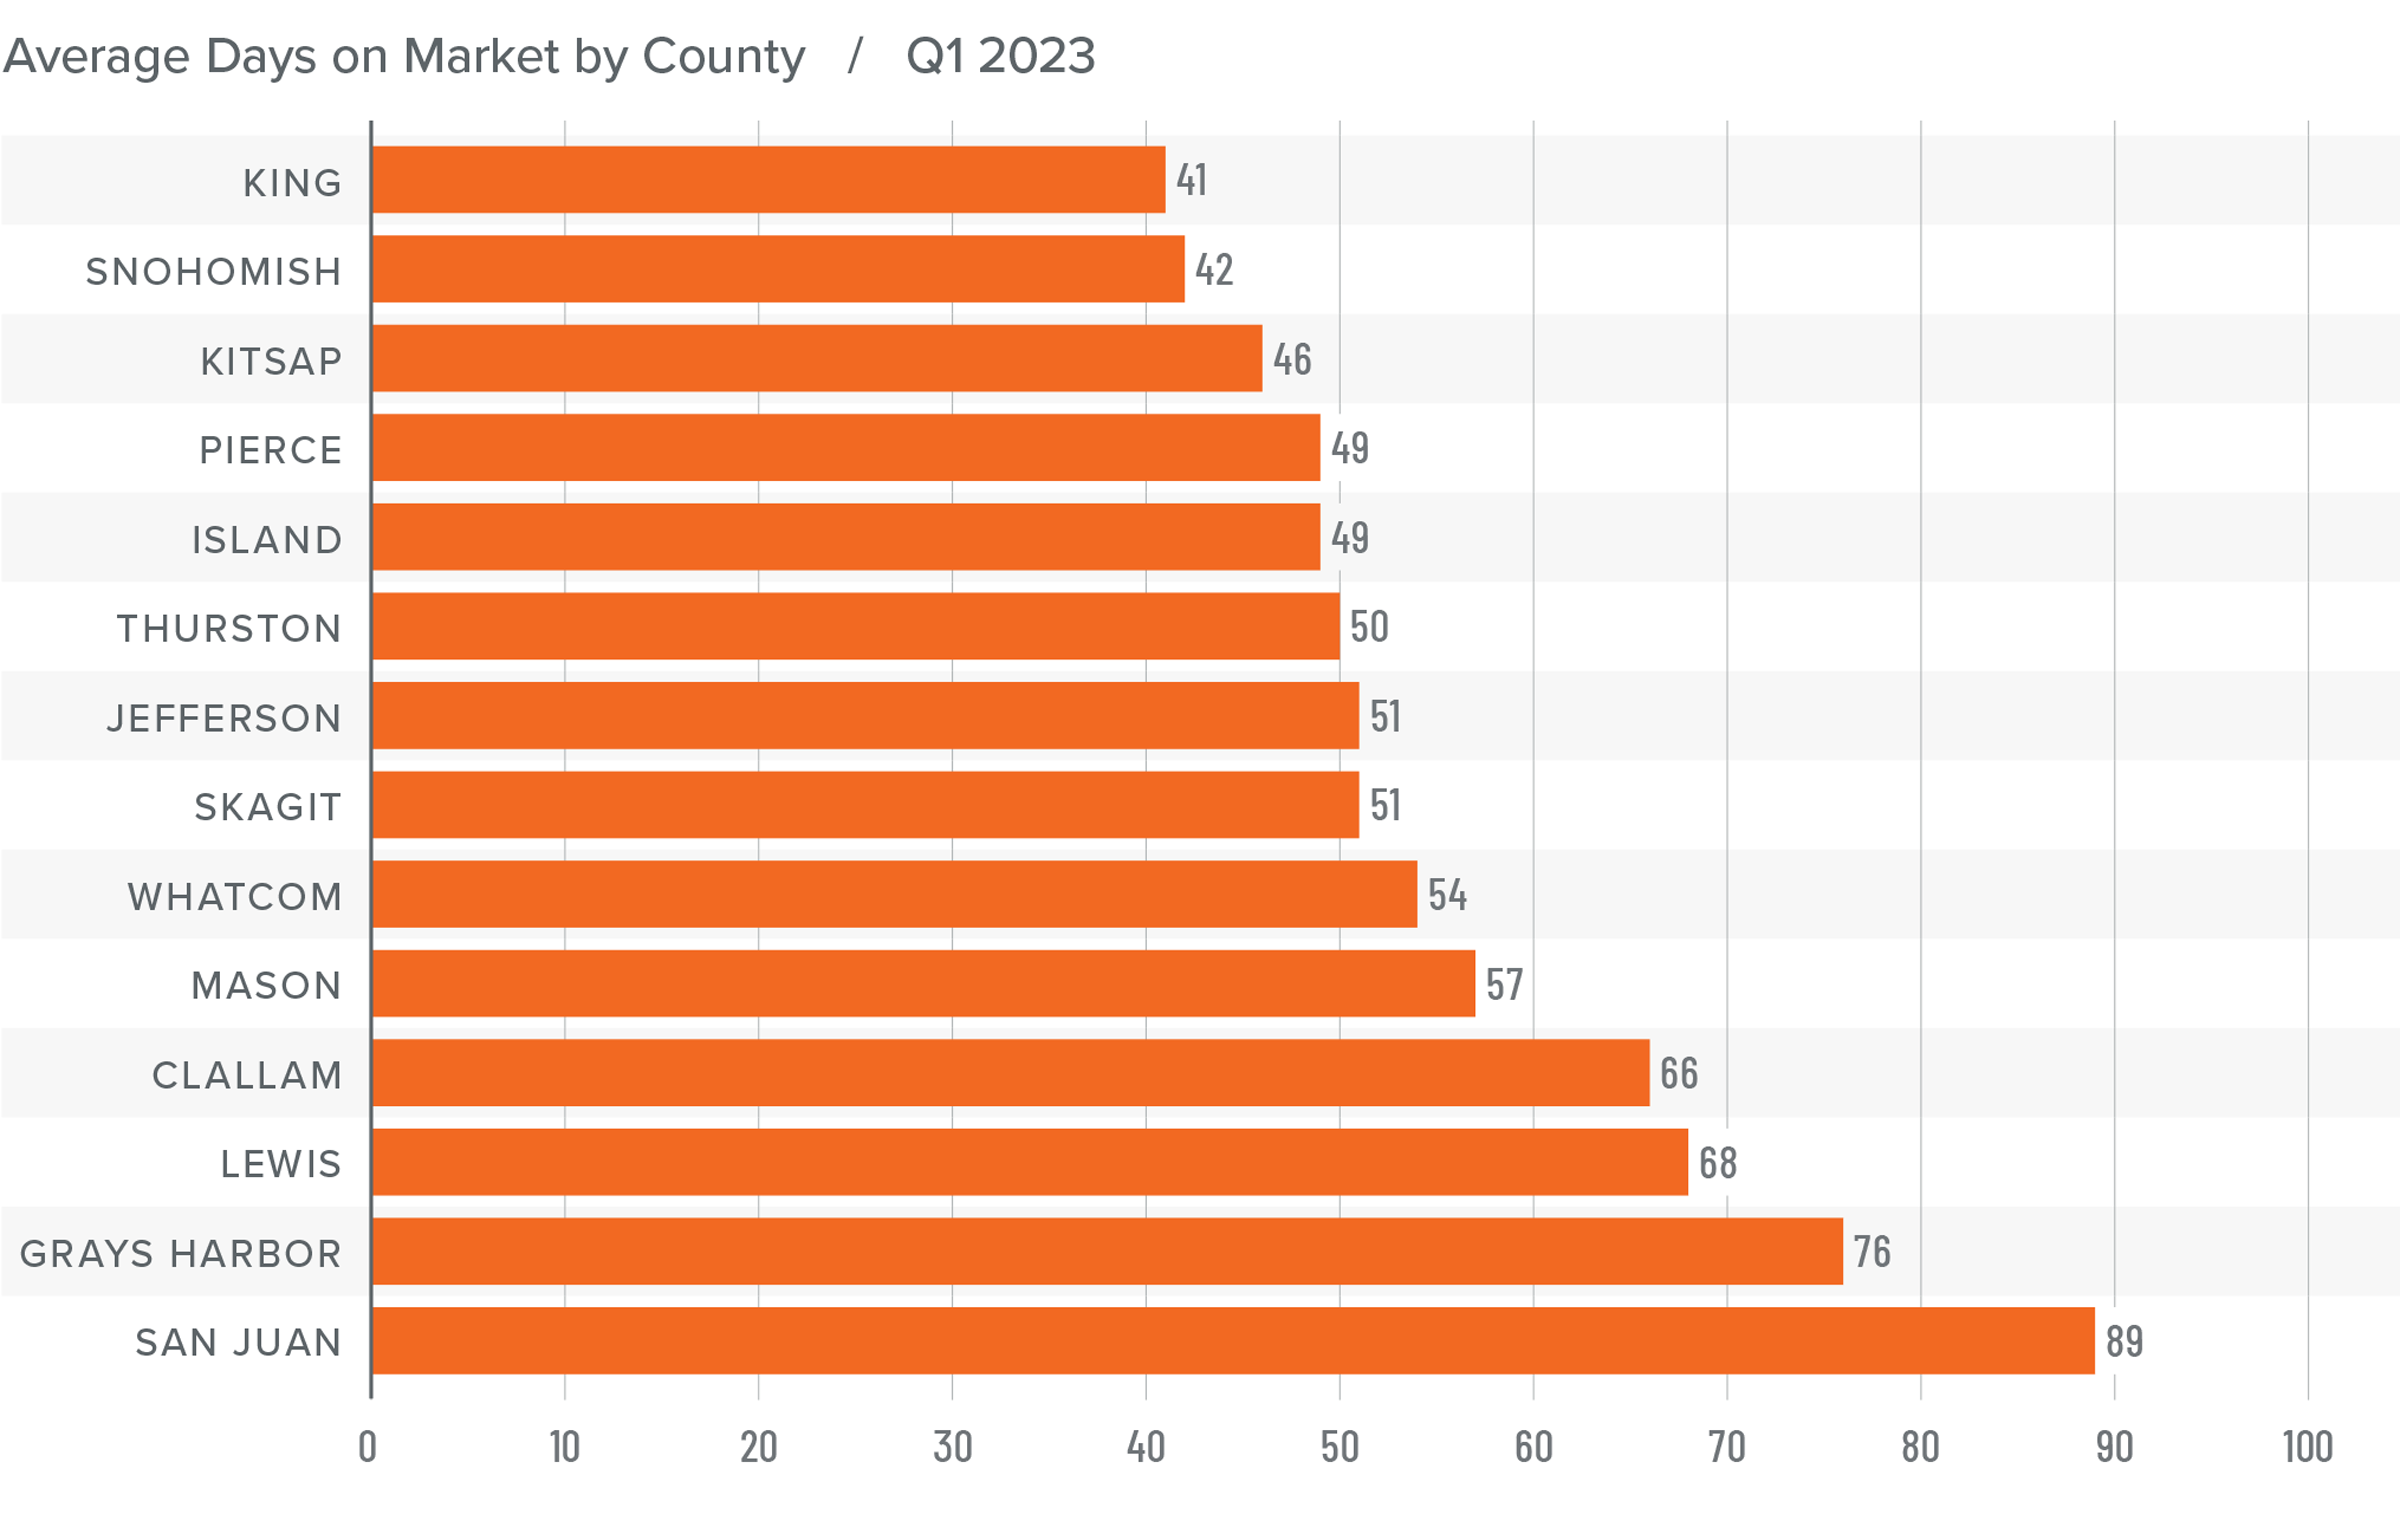
❱ It took an average of 56 days for a home to sell in the first quarter of this year. This was 32 more days than in the same quarter of 2022 and 16 days more than in the fourth quarter of last year.
❱ King County remains the tightest market in Western Washington, with homes taking an average of 41 days to sell. Homes in San Juan County took the longest time to sell.
❱ Market time rose in all counties contained in this report compared to the same period in 2022 and compared to the fourth quarter.
❱ The greatest increase in market time compared to a year ago was in Grays Harbor County, where it took an average of 41 more days for homes to sell. Grays Harbor County also saw the greatest increase in market time compared to the final quarter of 2022 (from 46 to 76 days).
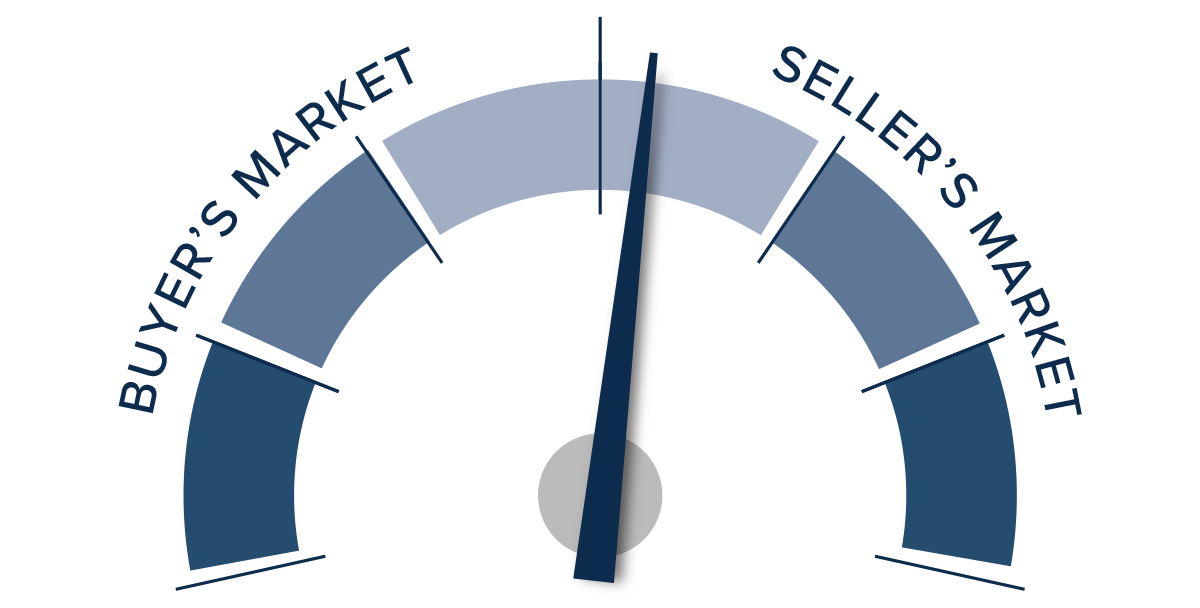
Conclusions
This speedometer reflects the state of the region’s real estate market using housing inventory, price gains, home sales, interest rates, and larger economic factors.
Although the regional economy is still expanding, it continues to show signs of slowing. With the probability of a national recession this year now fifty-fifty, I do not see any reason for buyers to lose confidence in their housing decisions based purely on economic factors. Sellers appear to be a little more confident in the market as demonstrated by rising listing prices. Periods of lower mortgage rates and the lack of homes for sale are both likely contributors to this. Whatever the case may be, I am not seeing any signs of panic in the market.

Even in the face of higher financing costs, low inventory levels support home values, and the data suggests that the worst of the price declines are now behind us. The region had fewer sales, modestly lower prices, and higher average days on market, all of which favor home buyers. However, lower inventory levels, higher pending sales, higher listing prices, and a higher absorption rate of homes that are for sale favor sellers. As such, I am moving the needle towards a balanced market, but one that ever so slightly favors sellers.
About Matthew Gardner

As Chief Economist for Windermere Real Estate, Matthew Gardner is responsible for analyzing and interpreting economic data and its impact on the real estate market on both a local and national level. Matthew has over 30 years of professional experience both in the U.S. and U.K.
In addition to his day-to-day responsibilities, Matthew sits on the Washington State Governors Council of Economic Advisors; chairs the Board of Trustees at the Washington Center for Real Estate Research at the University of Washington; and is an Advisory Board Member at the Runstad Center for Real Estate Studies at the University of Washington where he also lectures in real estate economics.