Facebook
 X
X
 Pinterest
 Copy Link
|


|

|
|

SOURCE: Windermere
The meaning of home has expanded over the years, adding new activities beyond eating and sleeping. For many this means home has more space to work and do hobbies. But as those things expanded, the feeling of relaxation may have dwindled, and for those struggling with the mental health implications of this, creating a space in your home that is dedicated to reducing stress could be the ticket to achieving a sense of peace and calm. Whether you use that space to meditate, exercise, or read, having a place in your home to focus on your mental health can change the way you show up for yourself and the important people in your life.
If exercise is your chosen route to improved mental health, a small home gym could be right for you. How you set up your fitness space will depend on your preferred form of exercise, as well as your budget.
If your routine requires a treadmill or indoor bicycle, make that the focal point of your space. If yoga, Pilates, or barre is more your speed, you’ll need room to unroll a mat and move freely. Weightlifting or body-weight exercises might necessitate more space and equipment but are both feasible even in a corner of your office or a walk-in closet.
Regardless of how you plan to get your sweat on, use nearby wall space for shelving or hooks to store equipment. This could range from light hand weights and exercise bands to jump ropes and yoga mats. If you need more storage, find furniture that serves multiple purposes. For example, a cabinet that stores towels can also double as a surface for a small fan and your water bottle.
For extra motivation to spend time in your exercise area, add a little personalization. Wallpaper or bold paint colors not only add visual interest, but they also create a sense of separation from the rest of the room or area. Soothing art and living plants are particularly apt for spaces dedicated to yoga.
Meditation is a great way to calm the mind, and you don’t need special equipment or a lot of room to do it. Creating your own meditation space can be simple, quick, and doesn’t require a large investment.
Start by finding a place in your house that is as free from distractions as possible. This could be a corner in your bedroom or a section of your backyard or terrace. Ideally the space would be near a window or natural light source.
Where and how you sit can make or break a meditation session. A chair, meditation cushion, or yoga mat that allows you to sit comfortably for several minutes while keeping you alert will do the trick.
If you plan to listen to guided meditations or music, a small Bluetooth speaker can be a good option if you want to avoid using headphones and will have better sound quality than listening from your phone’s speaker.
Though many people prefer to meditate with their eyes fully closed, visual elements can help set a serene scene. Plants, candles, statues, and art can also add a sense of your personality. If clutter stresses you out, keep your decor clean and minimalist. You can include your other senses in your meditations by adding a water feature and burning incense or essential oils.
If getting lost in a good book is your favorite way to unwind, a reading nook will quickly become your favorite spot at home.
Whether you’ve got a corner or a closet to dedicate to the space, the key to hours of reading enjoyment is the right seating. It’s hard to beat the traditional wingback or club chair, but smaller spaces might call for more creative ideas. Floor cushions, padded benches, bean bag chairs, and hammocks are all options.
Once you’ve got your sitting area situated, lighting comes next. A location near a window that brings in natural light is ideal, but for those who love to read late into the night or who don’t have a window nearby, standing or table lamps and wall sconces will save you from eye strain.
If you’ve got the space, a side table for cocoa, coffee, or tea is a nice addition. It’s also a great area for that mile-high “to be read” pile book lovers are known for. Even better if it’s got a drawer for bookmarks, reading glasses, pens, and notebooks.
For extra coziness, add a throw blanket or shawl and some cushy pillows.
SOURCE: Windermere

SOURCE: Windermere
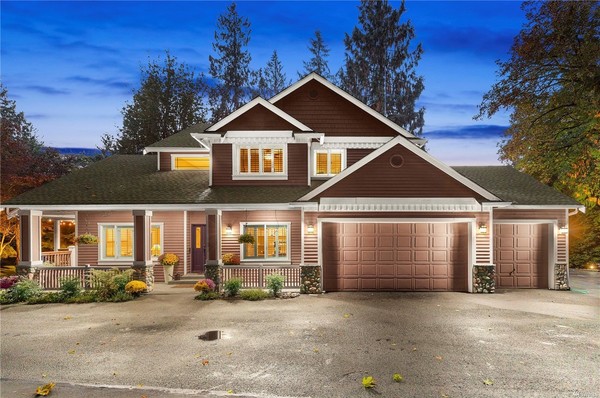
If you’re shopping for a new home, there are a number of factors you need to consider in order to narrow down your search criteria. Because before you can get too deep into your home search, you need to identify your needs, figure out your wants, and decide if there are any deal breakers that don’t work for you, such as the age, style, and location of your dream house. As you weigh the option between a new build or an older resale, here are six differences to note.
Surprisingly, one of the biggest factors in choosing a new home isn’t the property itself, but rather the surrounding neighborhood. While new homes occasionally spring up in established communities, most are built in new developments. The settings are quite different, each with their own unique benefits.
Older neighborhoods often feature tree-lined streets; larger property lots; a wide array of architectural styles; easy access to mass transportation, restaurants, and local shops; and more established relationships among neighbors.
New developments are better known for wider streets and quiet cul-de-sacs; controlled development; fewer above ground utilities; more parks; and often newer public facilities (schools, libraries, pools, etc.).
Consider your daily work commute, too. While not always true, older neighborhoods tend to be closer to major employment centers, mass transportation, and multiple car routes (neighborhood arterials, highways, and freeways), and new construction homes are usually found on the outskirts of city limits where there’s more land available for the development. The main exception being new townhouses on lots in the middle of established neighborhoods.
If you like Victorian, Craftsman, or Cape Cod style homes, it used to be that you would have to buy an older home from the appropriate era. But with new-home builders now offering modern takes on those classic designs, that’s no longer the case. There are even modern log homes available.
Have you given much thought to what type of floor plan you want? If you have your heart set on an open-concept layout with an entertainment kitchen, spacious primary suite, and walk-in closets, you’ll likely want to buy a newer home—or plan to do some heavy remodeling of an older home. Unless they’ve already been remodeled, most older homes feature more closed floor plans with structural separation between rooms.
If you have a specific home décor style in mind, you’ll want to take that into consideration, as well. Professional designers say it’s typically best if the style and era of your furnishings match the style and era of your house. But if you are willing to adapt, then the options are wide open.
Homes built before material and labor costs spiked in the late 1950s have a reputation for higher-grade lumber and old-world craftsmanship like hardwood floors, old-growth timber supports, ornate siding, artistic molding, etc.
However, newer homes have the benefit of modern materials and more advanced building codes, such as copper or polyurethane plumbing, better insulation, double-pane windows, modern electrical wiring, earthquake/ windstorm supports, and so on.
The condition of a home for sale is a top consideration for any buyer, whether you plan to do a little work or not. However, age is a factor here, as well. For example, if the exterior of a newer home needs repainting, it’s a relatively easy task to determine the cost. But if it’s a home built before the 1970s, you have to also consider the fact that the underlying paint is most likely lead-based, and that the wood siding may have rot or other structural issues that need to be addressed before it can be re-coated.
On the flip side, the mechanicals in older homes (lights, heating systems, sump pump, etc.) tend to be better built and last longer.
Regardless of the age of the home or the apparent condition, it’s important to get a home inspection from a professional.
One of the great things about older homes is that they usually come with mature trees and bushes already in place. Buyers of new homes may have to wait years for ornamental trees, fruit trees, roses, ferns, and other long-term vegetation to fill in a yard, create shade, provide privacy, and develop into an inviting outdoor space. However, maybe you have the patience and interest in building the yard you want, or you’re one of the many homeowners who prefer the wide-open, low-maintenance benefits of a lightly planted yard.
Like it or not, most of us are dependent on our cars for daily transportation. And here again, you’ll find a big difference between newer and older homes.
Newer homes in developments almost always feature ample off-street parking: usually a two-car garage and a wide driveway. Some new construction even includes electric vehicle charging stations as electric and hybrid cars become more mainstream. An older home, depending on just how old it is, may not offer a garage—and if it does, there’s often only enough space for one small or mid-sized car. For people who don’t want to leave their car on the street, this alone can be a determining factor.
While the differences between older and newer homes are striking, there’s certainly no right or wrong answer. It is a matter of personal taste, and what is available in your desired area. To quickly determine which direction your taste trends, use the information above to make a list of your most desired features, then categorize those according to the type of house in which they’re most likely to be found. The results can often be telling.
SOURCE: Windermere

SOURCE: Windermere
The truth is, the average size of apartments in the U.S. is shrinking, and studio and one-bedroom apartments are becoming more prevalent (rentcafe.com). This means knowing how to design for small spaces has never been more important. Whether you’re not quite ready to purchase a home or you’re looking to downsize, the creative possibilities are endless for maximizing square footage at home without sacrificing comfort or style. Let’s dive into some of the ways you can transform your home by making the most of your space.
All your essential items have to go somewhere, but how do you find a right place for everything without taking away from the rest of your home? Multifunctional furniture can be a lifeline for finding storage space without cluttering your home. Explore ottomans that have compartments to stow blankets, magazines, and other living room items. Folding desks can also ease the burden of storage without getting messy. Thanks to items like these, you can avoid investing in an outside storage unit just because you have limited square footage at home.
Fortunately, there’s more space available to you than the floor surface area of your home. Storage can be arranged vertically with items like hanging shelves and drawers. This can be especially helpful in the kitchen, where getting items up and away from the more cluttered areas within reach will clear counter space and make the space feel more open and inviting. Wall-mounted magnetic strips for knives and hanging racks for pots and pans can clear significant space.
When you move into a smaller space, you’ll be faced with a question: what do I really need? With only so much room available, this is the perfect opportunity for an exercise in minimalism. Paring down your possessions will reduce clutter and make the smaller spaces in your home feel roomier. Consider purchasing a bed with built-in storage drawers, which can eliminate the need for a bulky dresser in the bedroom. Get creative with floating shelves to lessen the need for large bookshelves and credenzas. Though these are common furnishings, they take up space and tend to dominate smaller rooms.
With a touch of creativity, you can transform your home’s interior while maximizing your square footage, and most importantly, making your home feel more like you.
SOURCE: Windermere

SOURCE: Windermere
You know your home is a valuable asset, but what is it actually worth? One of the most important figures to understand as you get ready to sell your home is Fair Market Value (FMV); it is key to a successful home sale. We’ll break down what Fair Market Value is and why it plays such a crucial role in the home selling process.
Fair Market Value (FMV) is the estimated price a property would sell for between a willing buyer and a willing seller, given that each party knows all the relevant information associated with the property. In other words, it’s the price your home is likely to sell for under the current conditions of your local real estate market.
Yes, you can research home prices on your own and get an idea of what your home is worth. However, accurately pricing your home requires a more in-depth approach. Your agent’s Comparative Market Analysis (CMA) will take into account the various factors that influence home prices using comprehensive data available to real estate agents on the Multiple Listing Service (MLS).
So, what’s the point of this detailed analysis? Pricing your home accurately is paramount. If it’s overpriced, you may deter potential buyers and it will lose value over time as it continues to sit on the market. If it’s priced too low, you might leave money on the table. FMV helps you strike the right balance.
You can also use Automated Valuation Models (AVMs) to see what your home could be worth. (That was the last acronym in this post, we promise!) These calculators give you a general idea of your home’s value, but AVMs are not 100% accurate. They’re a great starting point, but again, your agent’s resources will ultimately determine the right price for your home.
Fair Market Value sets the stage for smooth negotiations later in the home selling process. With a solid price in place, you’ll get reasonable offers from buyers. You and your agent will discuss whether to accept or counter the buyer’s offer and how to handle their contingencies. Finally, FMV makes the home appraisal process easier. With an accurate valuation in place, you can proceed knowing that the chances of a mismatching appraisal are low.
Several factors influence the Fair Market Value of a property. Comparable sales or “comps” play a significant role in determining FMV. Real estate professionals analyze recently sold homes in your area that are similar to yours, providing a benchmark for pricing your property. The property’s condition, its size, and location all factor into the math as well. Appraisers may also use a cost-based approach to determine FMV if they can’t find sufficient comparable homes in your area.
You can get a ballpark estimate of your home’s value by looking at tools online but determining a precise value will require the expertise of your real estate agent. To see what your home is worth, or for answers to all your home selling questions, connect with me today.
SOURCE: Windermere

SOURCE: Windermere

Windermere Real Estate offices throughout the Western U.S. brought holiday cheer and laughter to their local communities during the holiday season of 2023, wrapping up a year of giving that raised over $2.9 million for the Windermere Foundation, bringing the total raised since 1989 to more than $53 million.
Here are a few examples of the support provided by Windermere offices through the Windermere Foundation in the fourth quarter of 2023.
Windermere Group One continued a tradition and brought some holiday cheer to 21 deserving local families with their “Under Cover Elves” program. Since 2010, they have worked with the counselors at local schools to find and “adopt” families who were not able to buy gifts due to their financial situations. This year, some of the families were homeless, others were struggling after layoffs.
The school counselors mentioned too, that many support programs were not happening this year for families in need and they were grateful that the local Windermere offices were making this happen with Windermere Foundation funds.
More than 40 Windermere Real Estate agents and staff volunteers went shopping with the kids to buy presents for their parents and siblings. Many of the kids didn’t ask for things themselves, most lists consisted of everyday essentials like food, clothing, and cleaning supplies. But the volunteers were determined to add a few surprises too, so they did some digging while they shopped to find toys that they could add to the presents under the tree.
“The families were blown away from this event, so many thank you’s and tears of gratitude,” said Mikaya Blossner-Hill, the Marketing Director for the Windermere Group One offices.

Image Sources: Windermere Bozeman, MT on Facebook
The team at the Windermere Bozeman-Downtown office is fully devoted to supporting their neighbors in need and have a collective commitment to bettering the community they call home. One example of this is the $5,000 donation they made from the Windermere Foundation to the during the Greater Gallatin United Way weeks leading up to the holidays. The Greater Gallatin United Way raises funds from the community in order to invest in local non-profits working in four impact areas: basic needs (shelter, food security, transportation, and childcare), early learning, youth success, and behavioral health and mental well-being. The members of the Windermere Bozeman-Downtown office say that they feel incredibly fortunate to have the Greater Gallatin United Way looking out for their neighbors and their community.

Image Source: Melissa Freels, Director of Marketing Windermere Services, Oregon
The Windermere Johnson office in Portland, Oregon held a fundraiser that made many people smile and raised money for the Windermere Foundation. At the end of 2023 they put together a “Dogs of Windermere” calendar for the year 2024. This adorable fundraiser earned over $1,100 for the Windermere Foundation by selling copies of the calendars and with submissions from agents who sent in the cutest photos of their dogs they could muster; it wasn’t that hard. With such a successful first run they plan to do it again next year.
Continuing their yearly tradition, Windermere East, Inc. helped deliver holiday spirit to low-income and homeless families from in and around Bellevue, Washington with their “Windermere for Kids” event. In December, they invited over 100 local children to the Marketplace at Factoria to do their holiday shopping with 250 agents from six Windermere offices.
Each child and their families received $250 to buy gifts at Target, which were then wrapped by the Windermere Real Estate agents while the families enjoyed snacks and took photos with an elf. And as an added treat, the agents who helped them shop added a surprise gift for each “Little Shopper.”

Image Sources: Windermere Missoula, MT on Facebook
The agents in the Windemere Missoula office continued their tradition of collecting and donating food to the for their annual “Can the Cats Food Drive”. Now in its twenty-fourth year, the Can the Cats Food Drive is held every November leading up to the University of Montana vs. Montana State University “Griz-Cat Brawl of the Wild” rivalry football game. Missoulians are encouraged to donate food and cash which benefits thousands of households experiencing food insecurity in Missoula County. The Windermere Missoula team collected over 2,000 pounds of food from their local community which was delivered in bags donated by WinCo Foods Missoula. This was the eighth year Windermere Missoula participated in this event which Managing Broker John Brauer says is great fun and an incredible team-building experience.
The Windermere Foundation expanded the annual comedy night held in Portland, OR for the last 22 years to bring even more laughter and raise more money with another event in Seattle, WA.
Both events in 2023 featured Saturday Night Live comedian, Colin Jost. Together they raised over $1.1 million for local organizations supporting youth and families in need.
The annual Steve Allen Comedy Show in Portland, OR was founded by Windermere and benefits non-profit organization New Avenues for Youth, which is dedicated to the prevention and intervention of homelessness for Portland-area young people. The event helps New Avenues for Youth provide programs and services to young people in Portland that focus on the individual – their experiences, identities, needs and goals—and helping them make positive changes in their lives. From meals and counseling to job training and housing, their equity-based services address the many barriers to stability and well-being that young people face.
The inaugural Windermere Foundation Comedy Night in Seattle was organized by and benefited the Windermere Foundation, which has been giving back to the local communities where Windermere Real Estate agents live and work for 35 years. More than 400 people came together for a laughter-filled evening that included dinner, drinks, and an amazing amount of generosity. The money raised from ticket sales and the paddle raise will support organizations in the Seattle area that provide services to low-income and homeless children and families.
SOURCE: Windermere


SOURCE: Windermere
Some home designs reach way back through history. Greek Revival architecture is inspired by the principles of design formed in ancient Greece. These stately homes evoke a formal and traditional atmosphere akin to the feeling you get standing in the presence of the Parthenon. Let’s explore the history and features of these unique homes to understand what makes them so special.
1. Grand Entryways with Columns: The columns found in Greek Revival architecture are the defining characteristic of the style. Without these towering features, these homes simply wouldn’t feel the same. When used in a residential setting, columns help to create a feeling of grand stature by combining stories and stretching the verticality of the house. Columns were commonly found in important buildings constructed in ancient Greece, and today, they give Greek Revival architecture its timeless appeal.
2. Large Front Porches: In a residential setting, ample porch space creates a natural connection between the home and the outdoors. For all their grandeur, the way these homes are designed, there’s still a connection between them and their surrounding environment. As Greek Revival spread throughout the United States in the late 18th and early 19th centuries, different variations of the style were adopted to fit needs of the homeowners in different regions. However, porch space remained a universal feature of homes created in this style.
3. Decorative Windows: If the columns don’t give it away, the decorative dormer windows found in Greek Revival homes are a telltale sign of the style. These important features maximize natural light, which is perfectly displayed in the open layouts commonly found in these homes. The windows stretch vertically to complement the columns and give a very structured look to the exterior.
4. Ornate Details: Looking back at the most inspirational and renowned design works of ancient Greece, it’s no wonder that the opulent detailing of these magical buildings continued to be an important feature during the revival period. Intricate molding, ornate carvings, towering columns, and luxurious tile designs all reinforce the beauty of these homes. Marble was commonly used throughout these homes originally, inspired by the ancient Greeks’ preference for the rock in their building construction.
5. Greek Revival Architecture Color Scheme: The dominant color in the Greek Revival palette is white. Yes, white marble was prevalent throughout temples in ancient Greece, but the preference for white amongst the designers behind the revival movement had just as much sway in how we see this style represented today. Many Greek Revival homes found today are constructed with wood or stucco and painted white. In terms of interior design, this typically whitewashed palette gives you a clean slate to decorate on top of. Primary colors and natural, organic hues pair well with these classic buildings.
SOURCE: Windermere


For some buyers, purchasing a home independently may be out of reach. Co-buying a home is an alternative approach to homeownership where two or more individuals purchase the property together and take on a joint mortgage. Get to know the benefits and drawbacks of co-buying a home before deciding whether it’s right for you.
Just like a traditional home purchase, lenders use the buyers’ debt-to-income ratios and credit scores to determine their mortgage eligibility and formulate the terms of their loan. The lender will use the lowest median credit score to determine whether the co-buyers qualify. Before you purchase with a co-buyer, work with a real estate attorney to flesh out the details of the agreement including the distribution of shares, the responsibility of each party for the down payment and subsequent mortgage payments, and the home’s title. There are two main options for taking title to a home with a co-buyer.
For those who don’t have the buying power to purchase a home on their own, co-buying presents an opportunity to combine assets and enter the market. Since lenders will be factoring in both of your incomes, you and your co-buyer will increase your chances of being approved for a mortgage and securing a low interest rate. Both of you will build equity over time as you pay back your joint mortgage. Even after the down payment and mortgage payments, there are a handful of costs that come with being a homeowner. Co-buying allows you to split these costs, saving money on bills, utilities, maintenance costs, and the like.
Co-buying a home means you are relinquishing some control over the homeownership costs. At the end of the day, you can’t control your co-buyer’s finances. If a sudden life change leaves them financially unstable, the burden will fall on your shoulders, and you’ll have to make up the difference. Similarly, your credit score could take a hit if your co-buyer is unable to make their mortgage payments, even if you’ve consistently made yours.
Before entering a co-buying agreement, it’s important that you and your co-buyer are on the same page about the terms of ownership and your expectations as joint homeowners. Working closely together will help maintain the health of your finances, and most importantly, your relationship.

|
|


![W[REPORT] December 2023](https://d31hzlhk6di2h5.cloudfront.net/20231215/e5/91/80/98/68698722d5b6e989c88443f4_1280x558.gif)