Market NewsMatthew Gardner April 25, 2023

Mortgage Rate Predictions and Misconceptions

The Federal Reserve Bank of New York just released their 2023 Housing Survey, which shows how the U.S. population feels about the housing market. Windermere Chief Economist Matthew Gardner digs into the mortgage rate predictions, showing how demographics played a role in the results.

This video on mortgage rate predictions is the latest in our Monday with Matthew series with Windermere Chief Economist Matthew Gardner. Each month, he analyzes the most up-to-date U.S. housing data to keep you well-informed about what’s going on in the real estate market.


Mortgage Rate Predictions

Hello there! I’m Windermere Real Estate’s Chief Economist Matthew Gardner. This month we’re going to take a look at the latest SCE Housing Survey, which gives us a really detailed look at consumers’ psyche in regard to the housing market.

I’ve always been fascinated by surveys, as they frequently give me insights that I simply don’t get from just looking at raw data and, as luck would have it, the New York Fed just released its 2023 Consumer Expectations Housing Survey. Now, this particular survey has always given me some great and often surprising insights as to how the U.S. population views the overall housing market. We certainly don’t have time to cover all of the questions that the survey poses, but there was one section I wanted to share with you today as it really resonated with me, and it relates to mortgage rates.

Will mortgage rates continue to rise?

A double line graph showing mortgage rate predictions. Specifically, it shows the average interest rates for 30-year fixed-rate mortgages from 2014 to 2023 and ends with the predicted values by U.S. households as captured in the Federal Reserve Bank of New York in their 2023 Housing Survey. People think the rate will be 8.8% three years from now and 8.4% one year from now.


The first question asked was where they expected mortgage rates to be one year from now. And as you see here that, on average, households expected rates to rise all the way up to 8.4%. Although some may see this as extreme, you can see that in the 2022 survey respondents predicted rates would hit 6.7%, almost exactly where they were at the beginning of this March.

And when asked where they thought rates would be three years from now, on average, households expected to see them climb to 8.8%. Now, that’s a rate we haven’t seen since early 1995!

Well, I’m not sure about you, but I was very surprised by these results as they counter just about every analyst’s expectation regarding where rates will be over the next few years. In fact, myself and every economist I know believes that rates will slowly pull back as we move through this year. I haven’t seen a single forecast suggesting that mortgage rates will rise to a level this country hasn’t seen in decades.

But as they say, the devil’s in the details. When I dug deeper into the numbers, it became very clear to me that demographics played a pretty big part in guiding people’s answers. Let me explain.

1-Year Mortgage Rate Expectations by Education

A double line graph showing mortgage rate predictions. Specifically, it shows the average interest rates for 30-year fixed-rate mortgages from 2014 to 2023 and ends with the predicted values by U.S. households separated by educational level completed as captured in the Federal Reserve Bank of New York in their 2023 Housing Survey. In the light blue line, respondents with a GED or less think the rate will be 9.4% in one year. In the dark blue line, respondents with a Bachelors degree think the rate will be 6.7% one year from now.


Here the data is broken down by educational achievement. You can see that survey respondents who didn’t have a college degree thought that mortgage rates would rise to 9.4% within a year. But college graduates were far more optimistic, and they expected rates to be in the high 6’s.

3-Year Mortgage Rate Expectations by Education

A double line graph showing mortgage rate predictions. Specifically, it shows the average interest rates for 30-year fixed-rate mortgages from 2014 to 2023 and ends with the predicted values by U.S. households separated by educational level completed as captured in the Federal Reserve Bank of New York in their 2023 Housing Survey. In the light blue line, respondents with a GED or less think the rate will be 10.1% in three years. In the dark blue line, respondents with a Bachelors degree think the rate will be 6.4% three years from now.


And when asked to look three years outrespondents without degrees expected rates to break above 10%. While college graduates saw them pulling back a little from their one-year expectations of 6.7%, down to 6.4%.

Now we are going to look at the survey results broken down by housing tenure.

1-Year Mortgage Rate Expectations by Tenure

A double line graph showing mortgage rate predictions. Specifically, it shows the average interest rates for 30-year fixed-rate mortgages from 2014 to 2023 and ends with the predicted values by U.S. households separated by housing status as captured in the Federal Reserve Bank of New York in their 2023 Housing Survey. In the light blue line, renter household respondents think the rate will be 10.9% in one year. In the dark blue line, homeowner household respondents think the rate will be 7.3% one year from now.


And here you see that renters expect mortgage rates to be at almost 11% within a year. And homeowners also saw them rising, but only up to 7.3%. 

3-Year Mortgage Rate Expectations by Tenure

A double line graph showing mortgage rate predictions. Specifically, it shows the average interest rates for 30-year fixed-rate mortgages from 2014 to 2023 and ends with the predicted values by U.S. households separated by housing status as captured in the Federal Reserve Bank of New York in their 2023 Housing Survey. In the light blue line, renter household respondents think the rate will be 12.1% in three years. In the dark blue line, homeowner household respondents think the rate will be 7.4% three years from now.


And over the next three years, renters expected rates to break above 12%. That’s a level not seen since the fall of 1985. But homeowners expected to see rates at a somewhat more modest 7.4%.

So, what does this tell us? I see two things.

Firstly, the rapid increase in mortgage rates that we all saw starting in early 2022 has a lot of people believing that we will see rates continuing to rise, sometimes at a very fast pace, over the next few years. I mean, if it happened before, why can’t it happen again? And this mindset leads me to my second point, which is that it’s very clear that a lot of would-be home buyers just don’t understand how mortgage rates are calculated.

The bottom line here is that I see a potential buyer pool out there that needs educating and that can give an opportunity to brokers to discuss how rates are set and where the market is expecting to see them going forward.

This may alleviate the concerns that many households have who may be thinking that they will never be able to afford to buy a home because of where they expect borrowing costs to be in the future. Education is everything, don’t you agree?

As always, I’d love to get your thoughts on this topic so please comment below! Until next month, take care and I will see you all soon. Bye now.

To see the latest housing data for your area, visit our quarterly Market Updates page.


About Matthew Gardner

As Chief Economist for Windermere Real Estate, Matthew Gardner is responsible for analyzing and interpreting economic data and its impact on the real estate market on both a local and national level. Matthew has over 30 years of professional experience both in the U.S. and U.K.

In addition to his day-to-day responsibilities, Matthew sits on the Washington State Governors Council of Economic Advisors; chairs the Board of Trustees at the Washington Center for Real Estate Research at the University of Washington; and is an Advisory Board Member at the Runstad Center for Real Estate Studies at the University of Washington where he also lectures in real estate economics.

Living April 17, 2023

What Are Energy Star Appliances?

What would life be like without appliances? Our reliance on our dishwashers, laundry machines, etc. makes them an integral part of our homes. They keep the house clean and ensure that the well-oiled machine that is your home life continues to run smoothly. Fortunately, Energy Star appliances are more sustainable than others and can save you money on your utility bills.

What are Energy Star appliances?

Energy Star products use less energy than other home appliances. Because they are more energy efficient, they help to protect the environment by reducing harmful emissions. These products adhere to strict guidelines set forth by the U.S. Environmental Protection Agency (EPA) and U.S. Department of Energy. Over the lifespan of these home appliances, you can save significantly on energy costs.

You’ll find the Energy Star badge on common home appliances such as refrigerators and dishwashers, but over the years, the program has expanded to other systems throughout the home including HVAC systems, water heaters, TV sets, and more.


A Caucasian man loads an Energy Star dishwasher in his kitchen. The kitchen has white tile floors, navy blue cabinets, and a light blue floral carpet.

Image Source: Getty Images – Image Credit: SolStock


These appliances accomplish improvements in sustainability through various product features. Here are just a few examples of their efficiency gains compared to non-certified appliances, courtesy of the Energy Star Appliances Brochure.

  • Certified refrigerators are about 15% more energy-efficient
  • Certified freezers use about 10% less energy
  • Certified dehumidifiers use 15% less energy (roughly $175 lifetime savings)
  • Certified air cleaners are 40% more energy-efficient (roughly $25 annual utility bills savings)
  • Certified dishwashers are 10% more energy-efficient and 20% more water-efficient (average 1,900 gallons of water savings over product lifetime)
  • On average, certified laundry machines can cut energy costs by one-third and water costs by more than half

To truly make improvements in your energy output, it’s helpful to establish a baseline. By sorting through your utility bills, you’ll gain an understanding of how your household’s energy output is distributed, allowing you to identify areas for improvement. Using these special appliances is just one way to accomplish more sustainable living at home. By combining these products with other eco-friendly practices, you’ll see your energy expenses decrease while feeling a sense of pride that you’re doing your part to protect the environment.

To maximize your appliances, it’s important to keep them clean.

Buying April 3, 2023

Buying a New Construction Home

You’ve got several options to choose from when buying your next home. With existing homes, it’s in sellers’ best interest to spruce up their properties, so they’ll usually complete some kind of upgrades, curb appeal projects, and remodeling before hitting the market. A new construction home, however, has no previous owner; it comes brand new. Learning about the new construction buying process will help you understand how it differs from other types of housing, such as existing single-family homes, townhouses, condominiums, etc.

What is a new construction home?

New construction homes are kick-started from two primary sources: the homeowners themselves and developers. When a homeowner is having a home custom built, they work with contractors to build it to their desired specifications on a lot they’ve purchased. This tailored approach comes at a price; building a custom home generally costs more than purchasing a new build from a developer.

When going the developer route, buyers have options to choose from, namely tract homes and spec homes.

Tract homes make up new neighborhoods on land bought by the builder. They bear a strong resemblance to each other but may offer customizable floor plan and design options to tailor the home to the buyer’s liking.

Spec homes are finished, move-in-ready new builds. Though they offer little to no customization, they may be the right option for you if you’re looking to move right away.

There are four component parts of building a new construction home: land, labor, materials, and regulation. Builders combine those costs to determine what price they need to sell the home to make a profit, accounting for local real estate market trends. However, if the market is driving up those costs, builders are less likely to continue building. As a buyer, keeping tabs on the housing market will help you understand the landscape of available new construction homes.


A row of tract new construction homes in a newly developed suburban neighborhood. The home in the foreground is finished, the rest in the row are framed but without siding.

Image Source: Getty Images – Image Credit: jhorrocks


Pros of a New Construction Home

  • New materials, appliances, and fixtures
  • Customization without having to remodel
  • Less maintenance than an older home

Cons of a New Construction Home

  • Custom home costs can be high
  • Move-in date dictated by builder’s timeline
  • Market conditions can drive up prices/halt production

Buying a New Construction Home

The financial preparations you’d take for purchasing an existing home apply to buying a new construction home. You’ll get pre-approved for a mortgage early on and form a saving strategy for how to make a down payment.

There’s less room for negotiation in new construction home transactions, so you and your agent should thoroughly discuss what kind of offer you’re able to make. Your agent is your greatest asset during this part of the process; lean on them to understand how to make an offer. You’ll also want to know whether a home warranty comes with the purchase of the new construction home and its cost structure.

Even though these homes are brand new, it’s still worth it to get a home inspection to discover any outstanding repairs that need to be made and begin a dialogue with the builder about fixing them before you move in.

Going into the buying process, it helps to know which new construction homes you’re able to afford. This allows you and your agent to work together to find the best candidate properties.

Market NewsMatthew Gardner March 28, 2023

Will Rising Foreclosures Impact the Housing Market?

How will rising foreclosures impact the U.S. housing market? To give his answer, Windermere Chief Economist Matthew Gardner sheds light on the latest foreclosure data and shows how prepared home buyers are to manage their mortgage debt today compared to the 2000s.

This video on foreclosures is the latest in our Monday with Matthew series with Windermere Chief Economist Matthew Gardner. Each month, he analyzes the most up-to-date U.S. housing data to keep you well-informed about what’s going on in the real estate market.


Rising U.S. Foreclosures

The market has certainly shifted since mortgage rates started skyrocketing last year and, with prices pulling back across much of the country, some have started to become concerned about the likelihood of foreclosures rising—clearly a timely topic given current circumstances.

Hello there! I’m Windermere Real Estate’s Chief Economist Matthew Gardner and for this month’s episode of Monday with Matthew, I pulled the latest data on foreclosure starts and looked and the quality of mortgages that have been given to buyers in order to give you a clear idea of how foreclosures will impact the overall housing market.

For the purposes of this exercise, I’m going to concentrate on foreclosure starts rather than foreclosure filings because data shows us that a majority of homeowners where a foreclosure filing has been submitted to a court by their lender are able to avoid it by refinancing or selling the home, which makes total sense as over 93% of owners in the U.S. have positive equity.


U.S. Foreclosures: Starts 2007-2022

A bar graph showing U.S. foreclosures starts from 2007 to 2022. The numbers spiked in 2009 at over 2 million foreclosure starts and gradually decreased every year until 2022, where the numbers increased from 2021. Though they were 181% higher in 2022 than in 2021, it’s important to note that foreclosure starts in 2022 were 31% lower than 2019 and 88% lower than the 2009 peak.


As you can see here, foreclosure starts rose significantly last year. In fact, they were 181% higher than in 2021. But if we zoom out, it’s important to note that foreclosure starts were 31% lower than 2019 and 88% lower than the 2009 peak.

Am I surprised at the increase in foreclosure starts? Not really. The forbearance program was put in place at the start of the pandemic, and it allowed homeowners to temporarily stop making mortgage payments and not be foreclosed on, but that program ended 18 months ago.

And, although a vast majority of the 4.7 million households who entered the program have left it and sold or refinanced their homes, there were always going to be some who were not able to, and this has led to the overall foreclosure activity rising. Let’s take a closer look.


U.S. Foreclosures in 2022

A map showing foreclosures starts for each state in the U.S. California, Texas, and Florida have the highest number of foreclosure starts inn 2022. California had 27,541, Florida had 24,190, and Texas had 23,151.


This is a heat map of foreclosure starts by state. And you can see that California, Florida, and Texas saw the highest numbers in 2022. But remember that these are the states that have the greatest number of homes with mortgages so, statistically, we would expect the total number of homes in foreclosure in those states would be higher than the rest of the country. That said, foreclosure starts were significantly higher in Florida, California, Texas, and New York than they were in 2019, the last “pre-COVID” year and before the forbearance program started.

And when we look more myopically, metro areas including New York/New Jersey, Washington DC, the Delaware Valley, Atlanta, Miami, Baltimore, and Dallas all saw total foreclosure starts rise well above what they were in 2019. This may suggest that there are some markets that could see foreclosure activity rise to a level that could materially impact housing in those locations.

But looking at the country as a whole, there are other factors leading me to believe that we will not see the number of homes entering foreclosure rising above the long-term average, and certainly not sufficient to have a material impact on U.S. housing prices. 

Let me show you what’s happening on the mortgage side of things. First: credit quality.


Median FICO Scores for New Mortgages 2003-2022

A line graph showing the median FICO scores for new mortgages from Q1 2003 through Q3 2022. The median FICO score generally decreased from 2003 to the low of 707 during 2007, then gradually increased throughout the years 2008-2022. The median FICO score inn Q3 2022 was 766.


The median FICO score for new mortgages was 766 in the 4th quarter of 2022. Yes, this is down from the peak seen in early 2021 when it was a whopping 788 but as shown here, it’s far higher than we saw before the housing crisis. Buyers over the past several years had very good credit and, given the tight labor market, we are certainly in a very different place than back before the housing bubble burst.


Mortgage Debt Payments Percentages 2007-2022

A line graph showing mortgage debt payments as a percentage of disposable personal income for home buyers from Q1 2007 through Q3 2022. In 2007, mortgage debt payments were around 7% of disposable personal income, in Q3 2022 it was 3.99%. Between those two points in time, the percentage gradually and consistently decreased.


Secondly, buyers are using larger down payments than in the mid-2000’s, and with the historically low mortgage rates that we saw during the first two years of the pandemic benefitting new buyers as well as allowing existing homeowners to refinance, the share of disposable income that is used to cover mortgage payments remains very low. This basically means that owners aren’t as burdened by their house payments as they were in 2007-2009. And finally…


Equity Rich Households Q4 2022

A map showing the percentage of equity rich households for each state in Q4 2022. The highest values are Vermont at 76.6%, Florida at roughly 62%, and California at 61.5%.


With the significant run-up in housing values that we have seen over the past few years, 48% of all homeowners with a mortgage have more than 50% equity. Although this share has pulled back a little as mortgage rates rose and values pulled back, it’s still a massive amount of money and, as I mentioned earlier, many homeowners who are faced with foreclosure will end up selling their homes as they still have positive equity rather than go through the foreclosure process.

So, my answer to those of you wondering if we will see foreclosures rise to a level that could impact the overall housing market is “no.”

I don’t see any reason to believe that distressed sales will hurt the market in general, but I will say that there are some local markets where distressed sales could rise to levels that could act as a headwind to price growth in these areas. As always, I’d love to get your thoughts on this topic so please comment below! Until next month, take care and I will see you all soon. Bye now.


To see the latest housing data for your area, visit our quarterly Market Updates page.


About Matthew Gardner

As Chief Economist for Windermere Real Estate, Matthew Gardner is responsible for analyzing and interpreting economic data and its impact on the real estate market on both a local and national level. Matthew has over 30 years of professional experience both in the U.S. and U.K.

In addition to his day-to-day responsibilities, Matthew sits on the Washington State Governors Council of Economic Advisors; chairs the Board of Trustees at the Washington Center for Real Estate Research at the University of Washington; and is an Advisory Board Member at the Runstad Center for Real Estate Studies at the University of Washington where he also lectures in real estate economics.

Design March 21, 2023

5 Features of Mid-Century Modern Interior Design

Few interior design styles have captivated our imaginations like mid-century modern. Though the mid-century modern movement began to impact design culture many decades ago, we still see its lasting impact today. This vintage style remains popular for homeowners everywhere and shows no signs of slowing down. To aid your home décor efforts, let’s dig a bit deeper into what makes mid-century modern so special.

What is mid-century modern interior design?

The mid-century modern movement came to define graphic design, architecture, product development, and interior design in the 1940s, 1950s, and 1960s. Its emphasis on simplicity was a direct reaction to the more opulent styles that preceded it, heralding a shift in suburban home life. Here are a few of its signature features.


A mid-century modern living room with an open credenza containing cameras and books, a comfortable yellow chair with wooden peg legs, a small minimalist table, and several house plants. The colors of the furniture and plants pop against the white walls and white sheer curtains.

Image Source: Shutterstock – Image Credit: Ground Picture


5 Features of Mid-Century Modern Interior Design

1. Minimalism

Both mid-century modern architecture and interior design live by the maxim “less is more.” With minimal decoration, the space between objects is emphasized, giving interiors a fresh and clean look. Straight lines are a tenet of this design style, reflected in the signature pieces of the era, such as the Eames chair (pictured below). This minimalist approach to interior design maximizes each object by removing all unnecessary elements.


A leather Eames chair in a modern brick loft apartment with hardwood floors, an open kitchen/dining room area, and a large bookshelf decorated with accent items and house plants.

Image Source: Shutterstock – Image Credit: Karen Culp


2. Combining Outdoor and Indoor

The minds behind the mid-century modern movement prioritized nature and questioned how interiors could interact with the outside world. Nowadays, it’s common for homeowners incorporating this style to decorate with house plants, but the harmony with nature extends further into home design with such elements as stone materials, exposed wood beams, and floor-to-ceiling windows to maximize natural light.

3. Mid-Century Modern Color Scheme

If you’re a fan of decorating with a neutral color palette, this style is perfect for your home. With a reliance on colors like black, white, cream, and grey, a quintessential feature of this décor style is using bolder colors as accents to pop against a neutral backdrop. Primary colors create added contrast and help to lead the eye throughout a room. Experiment with dark brown or black to create different moods within the mid-century modern color spectrum.


A mid-century modern living room with a herringbone hardwood floor, low leather couch and matching chair with black metal framing, a minimalist bookshelf, and a small coffee table with wooden peg legs.

Image Source: Getty Images – Image Credit: gremlin


4. Materials and Texture

Its ability to remain popular for decades is what separates this style. Its principles are still reflected in the latest home design trends. Perhaps nowhere is this more evident than its philosophy on materials and texture. It combines natural and synthetic materials to bridge the gap between eras, creating interiors that feel simultaneously vintage and modern. Plastic and fiberglass are commonly used manmade materials, while wood, marble, and stone are typical natural elements.

5. More Space, Less Clutter

Just as the space between objects is emphasized, open floorplans are typical in mid-century modern design to create spacious environments. Decorative décor is limited to reduce clutter, and enclosed storage spaces are kept to a minimum. If you’re planning to decorate in this style, it’s an opportunity to pare down your belongings and keep only what’s essential for your lifestyle at home.

Selling March 7, 2023

Deciding to Sell Your Home

Deciding when to sell your home can depend on a variety of factors. Perhaps your local market conditions are favorable to sellers, or you’ve recently changed jobs, or your family is growing and you need to upsize. Whatever the case may be, making the decision to sell your home is the first step in your selling journey.

Deciding to Sell Your Home

Once you know it’s time to sell your home, it’s natural to feel a wave of emotions. A home is an integral part of a homeowner’s life. They provide countless memories and, for many homeowners, are their greatest investment. But once you’ve decided to sell, it’s important to look at your home with an objective eye to appeal to a wide variety of buyers.

Which repairs should I make before selling my home?

To get your house in top selling shape, identify its outstanding repairs. As you fill out your list, separate the projects into categories which are DIY-eligible and which require a professional. This will help you to budget for your overall repair expenses and build a reasonable timeline. Some of the most important repairs to make before listing your home include fixing appliances, making sure your sinks and faucets work properly, repairing any cracks or holes in the walls, fixing all leaks and water damage, and ensuring that all systems in the home are functioning properly. Making repairs before you list your home will bode well for home inspections, negotiations, and can even give your home an advantage over other listings. Your agent may suggest a pre-listing inspection to make your home more competitive in a seller’s market.

Which upgrades should I make before selling my home?

When you sell your home, you’re inevitably competing against other listings in your area. The aesthetics of a house play a significant role in its ability to catch buyer’s attention, which emphasizes the importance of improving your curb appeal as you prepare to hit the market. Landscaping projects, new exterior paint, and upgrading your front entry are just a few ways you can spruce up the outside of your home.

And what about the interior? Consider upgrading to energy-efficient appliances, which are known for their high ROI potential. This is a great time to repaint your home’s interior as well. Consider using a neutral color palette to make it as appealing as possible to a wide-array of buyers. It’s also a good idea to identify rooms in which the flooring should be replaced or repaired. When remodeling your home’s flooring, choose a material that is within budget and has good resale value.

  • High ROI Remodeling Projects to Increase Home Value
  • Remodeling Projects to Avoid When Selling Your Home

Working With an Agent

Listing agents are trained professionals who work with homeowners to sell their homes. Your listing agent will be there to answer any questions you may have throughout the selling process and will negotiate with buyer’s agents to get the best price for your home. But their value doesn’t stop there. A listing agent will list the home, coordinate showings and open houses, and market the home. When searching for a real estate agent, find someone with whom you are compatible both emotionally and professionally, and who cares about the goals of you and your household.

What’s my home worth?

Homeowners can get a general idea of how much their home is worth by using online home value estimators, like Windermere’s free Home Worth Calculator. Though these tools can provide some context behind the value of your home, nothing compares to the in-depth analysis of an agent’s Comparative Market Analysis (CMA). Using a CMA, an agent can accurately price your home to get it sold quickly.

Market NewsMatthew Gardner February 28, 2023

Renting vs. Buying a Home: The Financial Benefits of Homeownership

This video is the latest in our Monday with Matthew series with Windermere Chief Economist Matthew Gardner. Each month, he analyzes the most up-to-date U.S. housing data to keep you well-informed about what’s going on in the real estate market.


Renting vs. Buying a Home

One of my followers asked me about some of the financial benefits of owning your home as opposed to renting. I find this topic interesting as there really is a “laundry list” of reasons that, from a financial standpoint, owning a home is better than renting.

I’m Matthew Gardner Chief Economist at Windermere Real Estate and welcome to this month’s episode of Monday with Matthew. Let’s get to the topic at hand. Of course, I don’t have time to go through them all today but here are the ones that I think are the most compelling: wealth building and tax benefits.

The Financial Benefits of Homeownership 

The first thing to understand is that, over time, a mortgage becomes easier to afford. You see, when you buy a home, the mortgage payments themselves don’t change and, over time, your earnings rise but the mortgage payment doesn’t. Simply put, unlike renters who generally see their rents going up every year, your mortgage payment never will and because you’ll hopefully be making more money as time goes by, the share of your income that you spend on a mortgage payment becomes less & less.

The next advantage to owning your home is that it is a good long-term investment. Of course, some will say that this is not the case because we went through the housing bubble bursting back in 2006 but there have actually been very few times in history when home prices have seen any long-term downward adjustment.

Now I know some will say that investing in stocks would give you a higher long-term return. My response to that would be I’ve never seen anyone living under a stock certificate. Have you?

My next reason for believing that ownership is better than renting is rather simple, and that is because a portion of every mortgage payment you make goes toward reducing the principal amount of the loan. Of course, during a majority of the term of the mortgage most of the payment is going towards interest but, a small portion is paying down the debt itself—in essence making it a forced savings plan, building wealth along the way.

Tax Advantages of Owning a Home

But what about the tax advantages? Owning a home offers unique and substantial ways to save on your taxes every year. Firstly, you can deduct your real estate taxes every year. Now, tax reform has limited the total allowed deduction, but it is still meaningful. You can also deduct the interest you pay on your mortgage. Again, there are some limitations but, depending on where you live you could save a significant amount.

And finally, let’s talk Capital Gains Taxes. When you sell your primary residence and have seen its value grow since you purchased it, up to $250,000 of that profit (if you’re a single person) or $500,000 if you’re married and filing jointly is tax free. Now, this is only true if you meet certain requirements with the biggest one being that you have to have lived in the house for a minimum of two years during the preceding five-year period.

If that’s not enough to convince you that there are very significant advantages to owning a home over renting, I will leave you with one last datapoint that you may find of interest.

Renting vs. Owning a Home: Household Net Worth

Using Federal Reserve data as a base, I’ve been able to calculate the median net worth of a household in America who owned their homes versus a household that rents.

  • In 2022, the median household wealth of a homeowner household here in America was approximately $330,000.
  • The median household wealth for a renter household in this country last year was just $8,000.

As you can see, that’s quite the discrepancy between the two. I think it’s very clear that homeownership for a vast majority of families is how they create most of their wealth.

I hope you found this topic of interest. Of course, if you have any questions or comments please do let me know as I do enjoy hearing from you. Take care and I look forward to talking to you all again next month.


Data combined and calculated by Windermere Economics


About Matthew Gardner

As Chief Economist for Windermere Real Estate, Matthew Gardner is responsible for analyzing and interpreting economic data and its impact on the real estate market on both a local and national level. Matthew has over 30 years of professional experience both in the U.S. and U.K.

In addition to his day-to-day responsibilities, Matthew sits on the Washington State Governors Council of Economic Advisors; chairs the Board of Trustees at the Washington Center for Real Estate Research at the University of Washington; and is an Advisory Board Member at the Runstad Center for Real Estate Studies at the University of Washington where he also lectures in real estate economics.

Buying February 20, 2023

How to Reduce Your Interest Rate: Mortgage Buydowns

This blog post contains contributions from Penrith Home Loans.


When mortgage rates are up, prospective buyers can often feel like they’re at a disadvantage as they go about securing a home loan. Fortunately, there are ways to lower your interest rate to make your monthly mortgage payments more affordable.

What are mortgage buydowns?

A mortgage rate buydown is a form of financing that allows you to secure a lower interest rate on your mortgage by paying more money upfront in the form of discount points, also known as mortgage points, at closing. Each discount point is equal to one percent of your total loan amount. Especially attractive in times of high mortgage rates, buydowns are offered by sellers, builders, or lenders depending on the transaction. There are two main types of mortgage interest rate buydowns: permanent and temporary.

Permanent Mortgage Buydowns

With a permanent interest rate buydown, typically the borrower, seller, or builder will contribute to the cost of buying down the rate permanently. In this situation, the borrower qualifies at the bought-down rate for the life of the loan.

Temporary Mortgage Buydowns

A temporary interest rate buydown provides cash flow for the borrower during the temporary period, but they still qualify at the higher note rate. Typically, the seller or builder will contribute to the cost of buying the rate down temporarily.

How do temporary mortgage buydowns work?

Temporary mortgage interest rate buydowns have their own unique structure. Below are three common types:

  • 1-0 Buydown Mortgage: The borrower gets a 1% discounted interest rate for the first year.
  • 2-1 Buydown Mortgage: The borrower gets a discounted interest rate for the first two years of the loan. The first year, the interest rate is 2% lower, decreasing to 1% lower the second year.
  • 3-2-1 Buydown Mortgage: The borrower gets a 3% discounted rate the first year, dropping to 2% in the second year and 1% in the third year.

Although they share certain characteristics with adjustable-rate mortgages (ARMs), temporary mortgage buydowns are slightly different. ARMs initially have a fixed interest rate period. Once the adjustable-rate period kicks in, both the interest rate and monthly payments are subject to change. With buydowns, the buyer’s interest rate doesn’t change; either the seller or lender covers part of the interest payments as outlined by the buydown’s structure.


A man and woman homeowner couple discuss the terms of a mortgage buydown program with their mortgage broker in a modern office setting.

Image Source: Getty Images – Image Credit: kate_sept2004


Should I permanently buy down my mortgage?

Though buying down your mortgage interest rate permanently can make the payments more affordable, if you are contributing to this cost, make sure you can withstand the heavier financial load before proceeding. It also depends on how long you plan to live in the home. For example, if you plan to move shortly after buying, the short-term savings on your mortgage may not yet break even on your upfront costs by the time you’re ready to purchase again.

Pros of Mortgage Buydowns

  • Savings on monthly mortgage payments
  • A lower rate means you could qualify for a higher loan
  • Discount points = prepaid mortgage interest, which is often tax-deductible

Cons of Mortgage Buydowns

  • Higher upfront costs of buying a home
  • If payments increase, higher risk of foreclosure
  • Less cash available for remodeling, home improvements, etc.


A home office desk is filled with materials for a full day’s work; a full coffee cup, a smartphone, paperwork, and a laptop with a mortgage loan application form on the screen.

Image Source: Getty Images – Image Credit: cnythzl


How much can I save with a mortgage buydown?

Here’s an example of the savings you could see with a 3-2-1 temporary mortgage buydown. Let’s say you qualify for a 30-year mortgage with a $400,000 loan amount at an interest rate of 7%. With a 3-2-1 buydown, you’d pay a 4% interest rate the first year, 5% the second year, and 6% the third year. From year four on, you’d pay 7%.


Purchase Price Down Payment Loan Amount Interest Rate APR Loan Term
$500,000 $100,000 $400,000 7% 7.125% 30 years


3-2-1 Temporary Mortgage Interest Rate Buydown


Year 1 Year 2 Year 3 Years 4-30
Interest Rate 4% 5% 6% 7%
Number of Payments 12 12 12 336
Monthly P&I Payment $1,909.66 $2,147.29 $2,398.20 $2,661.21
Total PITI Payment $1,909.66 $2,147.29 $2,398.20 $2,661.21
Monthly Reduction $751.55 $513.92 $263.01

  • Calculations provided by Penrith Home Loans
  • Temporary buydown cost as % of purchase price 3.67%


With this structure, you’d save $9,018.60 the first year, $6,167.04 the second, and $3,156.12 the third, for a total three-year savings of $18,341.76.

Market NewsMatthew Gardner February 6, 2023

Q4 2022 Western Washington Real Estate Market Update

The following analysis of select counties of the Western Washington real estate market is provided by Windermere Real Estate Chief Economist Matthew Gardner. We hope that this information may assist you with making better-informed real estate decisions. For further information about the housing market in your area, please don’t hesitate to contact your Windermere Real Estate agent.


Regional Economic Overview

Although the job market in Western Washington continues to grow, the pace has started to slow. The region added over 91,000 new jobs during the past year, but the 12-month growth rate is now below 100,000, a level we have not seen since the start of the post-COVID job recovery. That said, all but three counties have recovered completely from their pandemic job losses and total regional employment is up more than 52,000 jobs. The regional unemployment rate in November was 3.8%, which was marginally above the 3.7% level of a year ago. Many business owners across the country are pondering whether we are likely to enter a recession this year. As a result, it’s very possible that they will start to slow their expansion in anticipation of an economic contraction.

Western Washington Home Sales

❱ In the final quarter of 2022, 12,711 homes sold, representing a drop of 42% from the same period in 2021. Sales were 34.7% lower than in the third quarter of 2022.

❱ Listing activity rose in every market year over year but fell more than 26% compared to the third quarter, which is expected given the time of year.

❱ Home sales fell across the board relative to the fourth quarter of 2021 and the third quarter of 2022.

❱ Pending sales (demand) outpaced listings (supply) by a factor of 1:2. This was down from 1:6 in the third quarter. That ratio has been trending lower for the past year, which suggests that buyers are being more cautious and may be waiting for mortgage rates to drop.

A bar graph showing the annual change in home sales for various counties in Western Washington from Q4 2021 to Q4 2022. All counties have a negative percentage year-over-year change. Here are the totals: Jefferson at -19.9%, Skagit at -27.7%, Mason -30.7%, Lewis -30.9%, Clallam -34.3%, Whatcom -36.3%, Kitsap -38.5%, Snohomish -40.3%, Island -42%, Grays Harbor -42.3%, King -43.1%, Thurston -45.8%, San Juan -46.8%, Pierce -46.9%.

Western Washington Home Prices

❱ Sale prices fell an average of 2% compared to the same period the year prior and were 6.1% lower than in the third quarter of 2022. The average sale price was $702,653.

❱ The median listing price in the fourth quarter of 2022 was 5% lower than in the third quarter. Only Skagit County experienced higher asking prices. Clearly, sellers are starting to be more realistic about the shift in the market.

❱ Even though the region saw aggregate prices fall, prices rose in six counties year over year.

❱ Much will be said about the drop in prices, but I am not overly concerned. Like most of the country, the Western Washington market went through a period of artificially low borrowing costs, which caused home values to soar. But now prices are trending back to more normalized levels, which I believe is a good thing.

A map showing the real estate home prices percentage changes for various counties in Western Washington. Different colors correspond to different tiers of percentage change. Grays Harbor and Whatcom Counties have a percentage change in the -6.5% to -3.6%+ range, Clallam, Jefferson, King, and Skagit counties are in the -3.5% to -0.6% change range, Snohomish and Pierce are in the -0.5% to 2.4% change range, Mason, Thurston, Island, and Lewis counties are in the 2.5% to 5.4% change range, and San Juan County is in the 5.5%+ change range.

A bar graph showing the annual change in home sale prices for various counties in Western Washington from Q4 2021 to Q4 2022. San Juan County tops the list at 6.9%, followed by Lewis at 4.8%, Thurston at 3.8%, Island at 3.7%, Mason at 3.5%, Snohomish at 0.8%, Pierce at -0.2%, Clallam at -1%, Skagit at -2.1%, Jefferson at -2.5%, King at -3.1%, Whatcom at -4.1%, Kitsap at -5.3%, and finally Grays Harbor at -6.5%.

Mortgage Rates

Rates rose dramatically in 2022, but I believe that they have now peaked. Mortgage rates are primarily based on the prices and yields of bonds, and while bonds take cues from several places, they are always impacted by inflation and the economy at large. If inflation continues to fall, as I expect it will, rates will continue to drop.

My current forecast is that mortgage rates will trend lower as we move through the year. While this may be good news for home buyers, rates will still be higher than they have become accustomed to. Even as the cost of borrowing falls, home prices in expensive markets such as Western Washington will probably fall a bit more to compensate for rates that will likely hold above 6% until early summer.

A bar graph showing the mortgage rates from Q4 2020 to the present, as well as Matthew Gardner's forecasted mortgage rates through Q4 2023. After the 6.79% figure in Q4 2022, he forecasts mortgage rates dipping to 6.27% in Q1 2023, 6.09% in Q2 2023, 5.76% in Q3 2023, and 5.42% in Q4 2023.

Western Washington Days on Market

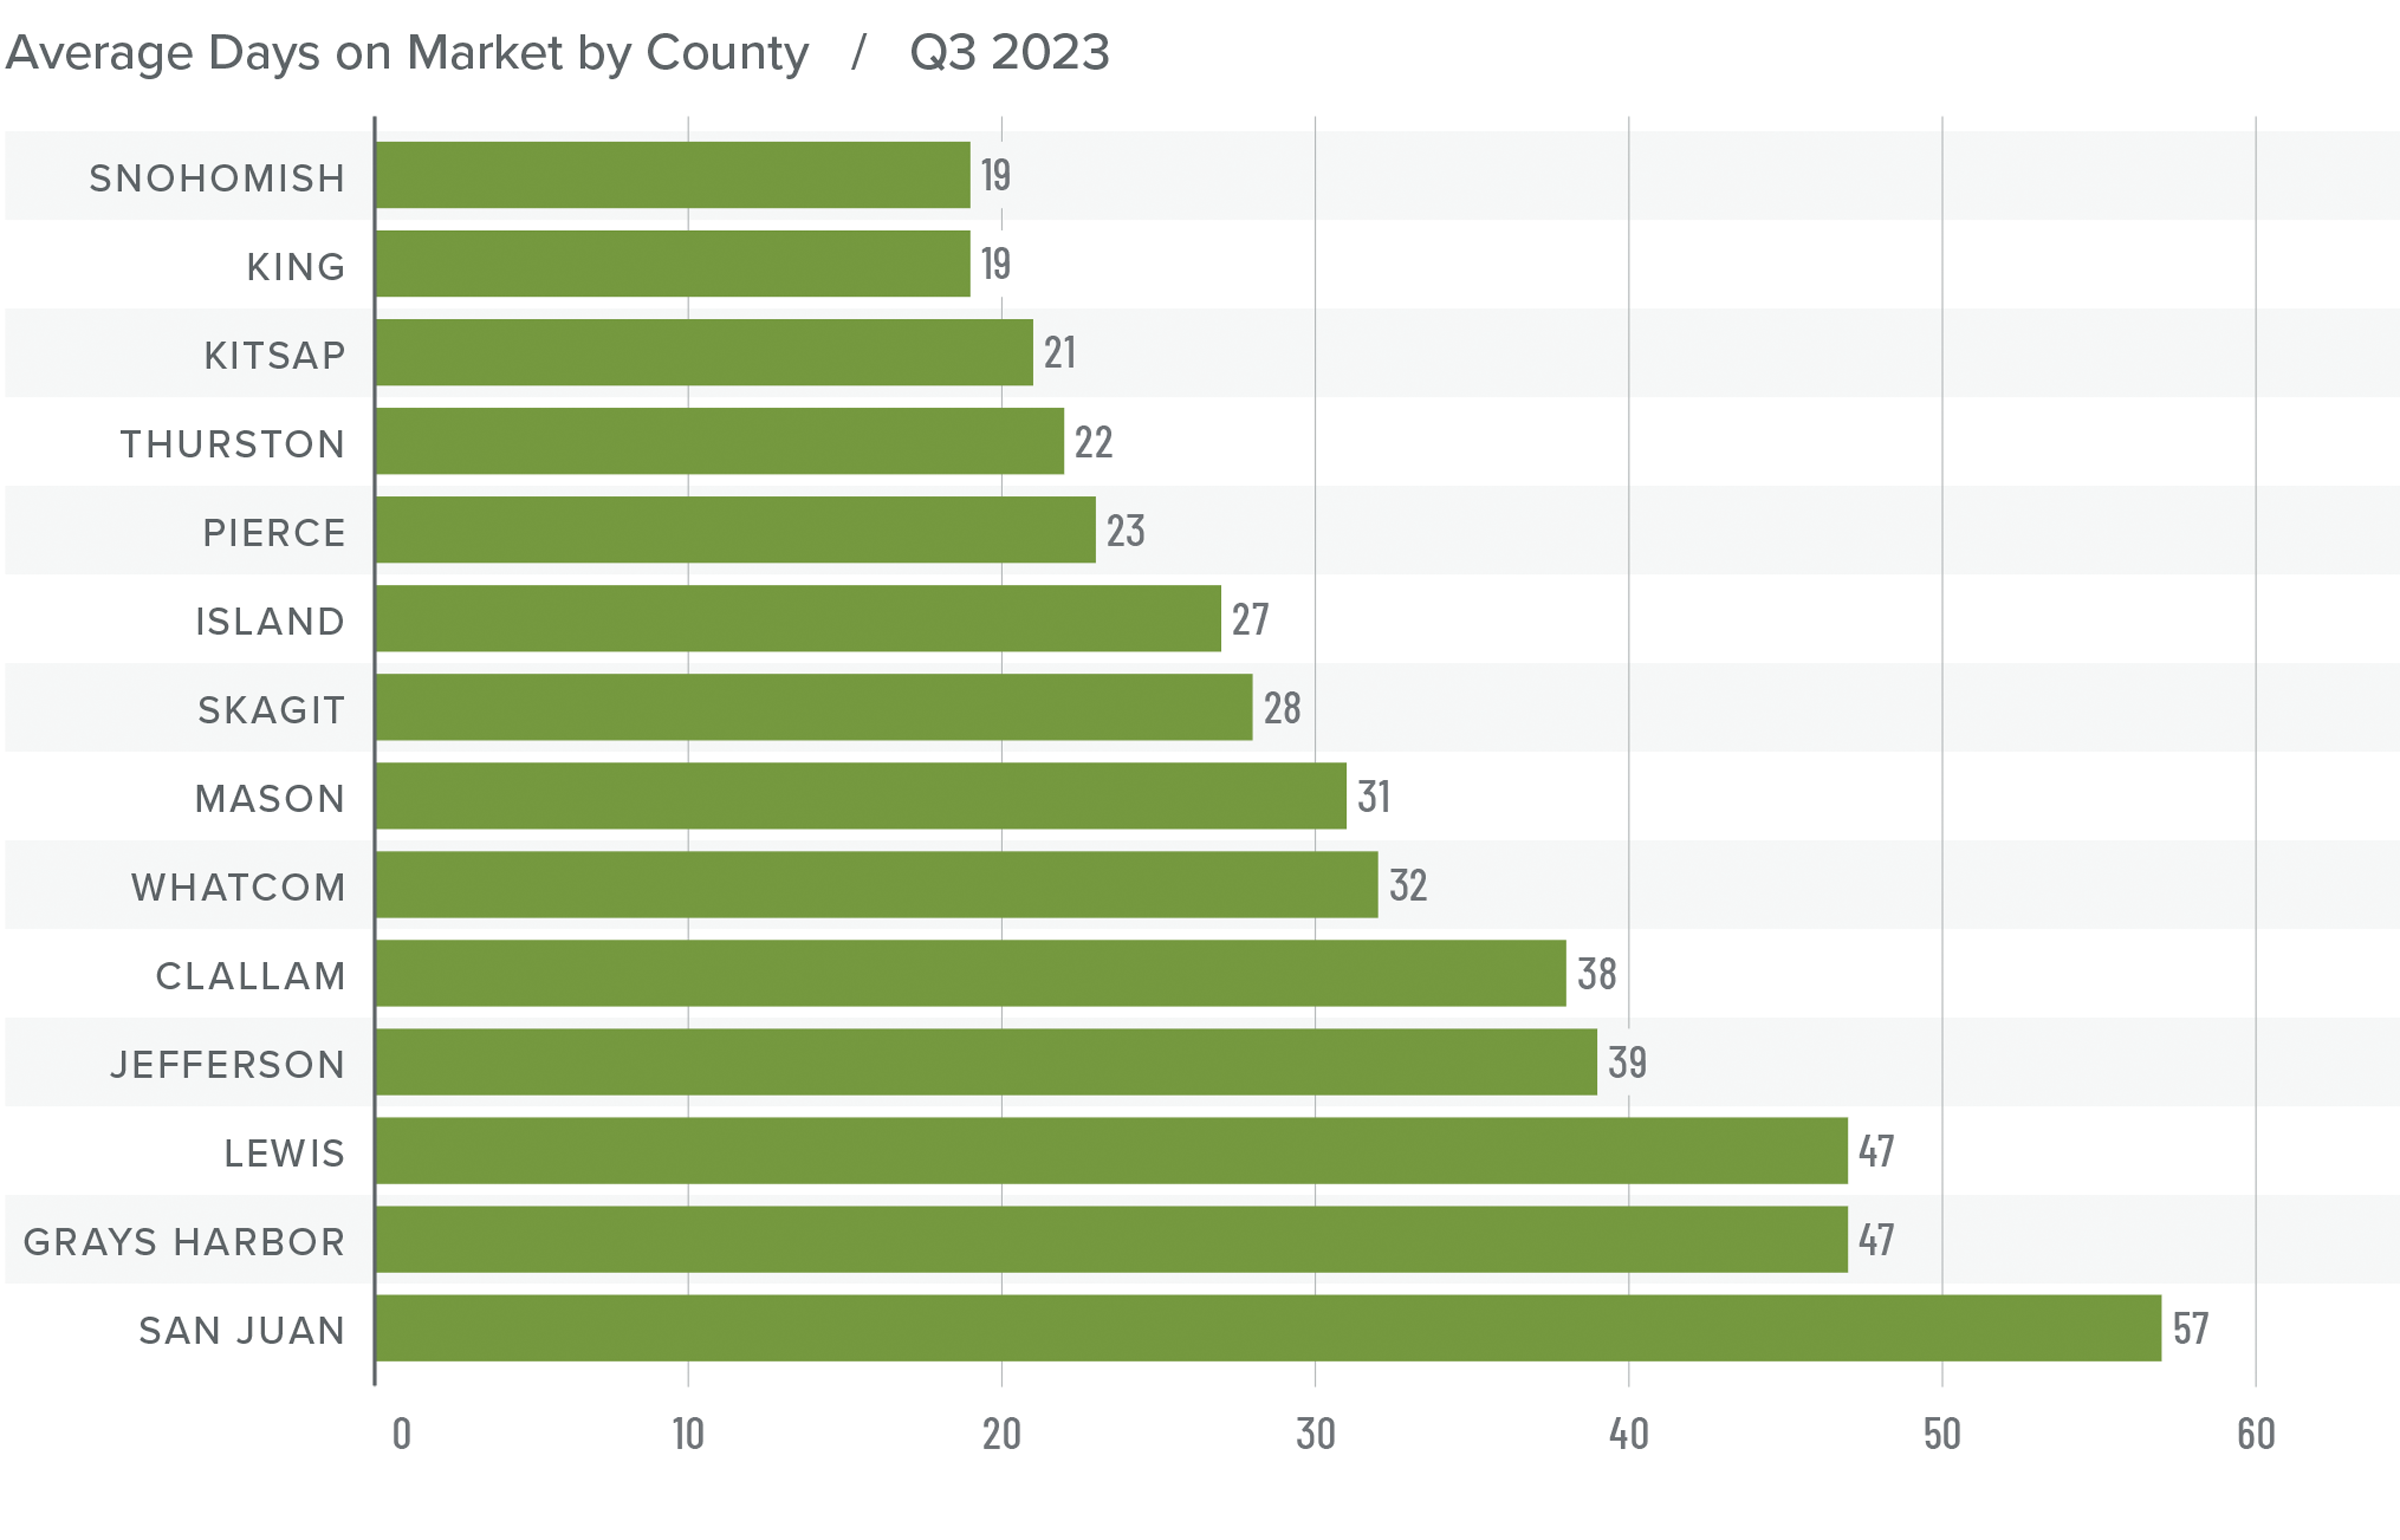
❱ It took an average of 41 days for homes to sell in the fourth quarter of 2022. This was 17 more days than in the same quarter of 2021, and 16 days more than in the third quarter of 2022.

❱ King County was again the tightest market in Western Washington, with homes taking an average of 31 days to find a buyer.

❱ All counties contained in this report saw the average time on market rise from the same period a year ago.

❱ Year over year, the greatest increase in market time was Snohomish County, where it took an average of 23 more days to find a buyer. Compared to the third quarter of 2022, San Juan County saw average market time rise the most (from 34 to 74 days).

A bar graph showing the average days on market for homes in various counties in Western Washington for Q4 2022. King County has the lowest DOM at 31, followed by Kitsap at 45, Island and Snohomish at 35, Whatcom, Thurston, and Skagit at 36, Pierce at 37, Clallam at 38, Jefferson at 40, Mason at 43, Grays Harbor at 46, Lewis at 49, and San Juan at 74.

Conclusions

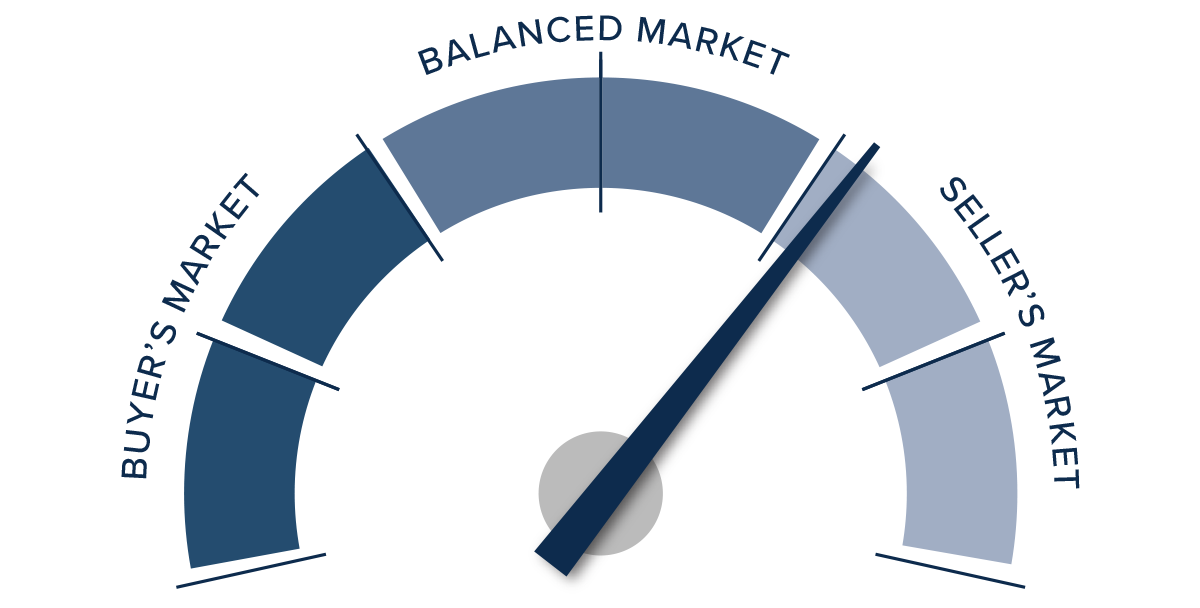
This speedometer reflects the state of the region’s real estate market using housing inventory, price gains, home sales, interest rates, and larger economic factors.

The regional economy is still growing, but it is showing signs of slowing. Although this is not an immediate concern, if employees start to worry about job security, they may decide to wait before making the decision to buy or sell a home. As we move through the spring I believe the market will be fairly soft, but I would caution buyers who think conditions are completely shifting in their direction. Due to the large number of homeowners who have a mortgage at 3% or lower, I simply don’t believe the market will become oversupplied with inventory, which will keep home values from dropping too significantly.

A speedometer graph indicating a balanced market, barely leaning toward a seller's market in Western Washington in Q4 2022.

Ultimately, however, the market will benefit buyers more than sellers, at least for the time being. As such, I have moved the needle as close to the balance line as we have seen in a very long time.

About Matthew Gardner

Matthew Gardner - Chief Economist for Windermere Real Estate

As Chief Economist for Windermere Real Estate, Matthew Gardner is responsible for analyzing and interpreting economic data and its impact on the real estate market on both a local and national level. Matthew has over 30 years of professional experience both in the U.S. and U.K.

In addition to his day-to-day responsibilities, Matthew sits on the Washington State Governors Council of Economic Advisors; chairs the Board of Trustees at the Washington Center for Real Estate Research at the University of Washington; and is an Advisory Board Member at the Runstad Center for Real Estate Studies at the University of Washington where he also lectures in real estate economics.

Market NewsMatthew Gardner January 23, 2023

2023 Real Estate Forecast: Why This Market Won’t Be Like 2008

This video is the latest in our Monday with Matthew series with Windermere Chief Economist Matthew Gardner. Each month, he analyzes the most up-to-date U.S. housing data to keep you well-informed about what’s going on in the real estate market.


Hello there, I’m Windermere’s Real Estate’s Chief Economist Matthew Gardner and welcome to the first episode of “Monday with Matthew” for 2023. As has become tradition, this first episode of the year will be dedicated to my real estate forecast for the U.S. housing market, so let’s get straight to it.

2023 Real Estate Forecast

Existing Home Sales & Forecast

From Matthew Gardner's 2023 real estate forecast, a bar graph showing the existing home sales for the years 2015 through 2021, plus forecasts for 2022 and 2023. The y-axis is in millions and the x-axis contains the years. The numbers are as follows (in millions): 5.3 in 2015, 5.5 in 2016 and 2017, 5.3 in 2018 and 2019, 5.6 in 2020, 6.1 in 2021, 5.1 (forecasted) in 2022, and 4.8 (forecasted) in 2023.

Image Source: Matthew Gardner


U.S. home sales trended lower through all of 2022 and, although I believe that sales will still have held above five million, this certainly won’t be the case in 2023. Affordability and higher financing costs will continue to act as headwinds when it comes to sales, but I think that the bigger issue will be that listing activity will not rise significantly as we move through the year.

As I have been saying for several months now, I don’t see why many households who don’t have to move will move and lose the historically low interest rate that they currently benefit from. That said, sales will still occur this year but at just 4.8 million, sales will be lower than we have seen since 2014.

Annual Change in Median Sale Prices

From Matthew Gardner's 2023 real estate forecast, a bar graph showing the annual change in median sale prices for homes in the U.S. real estate market. The years 2015 through 2023 are on the x-axis and percentages -4% through 20% run the length of the y-axis. The numbers are as follows: 6.8% in 2015, 5.1% in 2016, 5.7% in 2017, 4.9% in 2018 and 2019, 9.1% in 2020, 18.2% in 2021, 8.7% (forecasted) in 2022, and -1.1% (forecasted) in 2023.

Image Source: Matthew Gardner


Much has been said about the future of home prices, with some forecasters even suggesting that housing prices will collapse in a similar fashion to that seen following the bursting of the housing bubble back in 2008. Now, although price growth through the pandemic period was clearly excessive, fundamentally speaking, the two periods cannot be considered to be similar at all.

It’s my opinion that sale prices in 2023 will be very modestly lower than last year and I certainly don’t expect to see a collapse in home values.

But not all markets are created equal. The pandemic created what has become known as “Zoom-Towns.” These were cheap markets that affluent buyers flocked to because of their newly found ability to work from home and this led sale prices there to soar. It’s these locations that will likely see prices fall more significantly. Ultimately, expect to see prices fall through the first half of this year before starting to recover in the second half.

New Home Starts & Forecast (Single Family)

From Matthew Gardner's 2023 real estate forecast, a bar graph of the single-family new home starts. The y-axis shows numbers in thousands from 0 to 1,200 and the x-axis shows the years 2015 through 2023. The numbers are as follows: 715 in 2015, 782 in 2016, 849 in 2017, 876 in 2018, 888 in 2019, 991 in 2020, 1,127 in 2021, 1,009 (forecasted) in 2022, and 837 (forecasted) in 2023.

Image Source: Matthew Gardner


Looking now at the new construction market, housing starts fell last year as construction costs remained high and mortgage rates rose which lowered demand.  And I’m afraid that I do not see 2023 as being one where builders will deliver more inventory, with starts pulling back to a level the country hasn’t seen since 2016. That said, I am expecting a recovery in 2024 when new home starts will break back above the 1,000,000 level.

New Home Sales Forecast

From Matthew Gardner's 2023 real estate forecast, a bar graph showing the new home sales numbers from the U.S. housing market. The y-axis shows (in thousands) the numbers 200 to 900 and the x-axis shows the years 2015 through 2023. The number of new home sales are as follows (in thousands): 501 in 2015, 561 in 2016, 613 in 2017, 617 in 2018, 683 in 2019, 822 in 2020, 771 in 2021, 653 (forecasted) in 2022, and 584 (forecasted) in 2023.

Image Source: Matthew Gardner


New home sales in 2023 will fall further coming in below 600,000 but there is some light at the end of the tunnel with sales picking up fairly significantly again in 2024. We all understand that the country has a significant undersupply of ownership housing, but the costs associated with building new homes is still making it remarkably hard for builders even though they understand that demand will be significant for at least the next decade and a half given current demographics.

But the problem they will continue to face is that demand will primarily come from entry level buyers and, simply put, the cost to build a home precludes many developers from being able to meet this demand.

Average 30-Year Mortgage Rate & Forecast

A bar graph showing the average 30-year mortgage rate for the years 2015 through 2023. The y-axis shows percentages ranging from 0% to 7% and the years are displayed on the x-axis. The numbers are as follows: 3.9% in 2015, 3.7% in 2016, 4% in 2017, 4.5% in 2018, 3.9% in 2019, 3.1% in 2020, 3% in 2021, 5.4% in 2022, and 6.1% (forecasted) in 2023. This is the mortgage rate component of Matthew Gardner's 2023 real estate forecast.

Image Source: Matthew Gardner


And finally, my forecast for mortgage rates in 2023. Although this might not look good at all, as they say, “the devil is in the details.” Rates skyrocketed last year as the Fed stopped buying treasuries and mortgage-backed securities and, although they are off the highs we saw toward the end of last year, they are still significantly higher today than the market has become used to seeing.

As you can see here, I’m anticipating the average 30-year conventional rate to average 6.1% in 2023, but my forecast is actually a bit better than this shows.

Average 30-Year Mortgage Rate Forecast 2023

A bar graph showing the average 30-year mortgage rate in recent quarters, plus a forecast of the mortgage rate for each quarter in 2023. The y-axis displays percentages ranging from 0% to 7% and the x-axis displays the quarters from Q4 2021 to Q4 2023. The numbers are as follows: 3.1% in Q4 2021, 3.8% in Q1 2022, 5.3% in Q2 2022, 5.6% in Q3 2022, 6.8% in Q4 2022, 6.4% (forecasted) in Q1 2023, 6.1% (forecasted) in Q2 2023, 6% (forecasted) in Q3 2023, and 5.6% (forecasted) in Q4 2023. This is the mortgage rate component to Matthew Gardner's 2023 real estate forecast.

Image Source: Matthew Gardner


You see, my quarterly forecast suggests that rates have actually already peaked, and that they will trend lower as we move through this year and break below 6% by the fourth quarter. I would add that if anything my forecast may be a little pessimistic, and rates may end 2023 a little lower than I am showing here.

But that will depend on the Fed, and how long they will continue raising rates, and how long it will take before they start to lower them if the US enters a recession this year, which many forecasters including myself believe will be the case.

So, there you have it, my 2023 U.S. housing forecast. I will leave you with this one last thought. 2023 will be a transition year when the housing market will come off the “high” we saw during the pandemic and borrowing costs were artificially low.

I don’t see any reason for buyers or sellers to panic though. By the end of 2023, most markets will have corrected themselves and I believe we will see prices and demand start to pick up again toward the end of this year, but at a far more normalized pace.

As always, I look forward to your comments on my forecasts and I’ll see you all again next month. Take care now.


About Matthew Gardner

As Chief Economist for Windermere Real Estate, Matthew Gardner is responsible for analyzing and interpreting economic data and its impact on the real estate market on both a local and national level. Matthew has over 30 years of professional experience both in the U.S. and U.K.

In addition to his day-to-day responsibilities, Matthew sits on the Washington State Governors Council of Economic Advisors; chairs the Board of Trustees at the Washington Center for Real Estate Research at the University of Washington; and is an Advisory Board Member at the Runstad Center for Real Estate Studies at the University of Washington where he also lectures in real estate economics.