SOURCE: Windermere
Congratulations on your new investment property! Now comes the exciting part: Turning your property into a revenue-generating machine. While it’s not exactly easy, your goals are within reach if you take steps to organize, plan, and build a solid foundation. Here are some ways to help maximize your property’s potential in the short and long term while avoiding future headaches.
Ensure your property is up to code
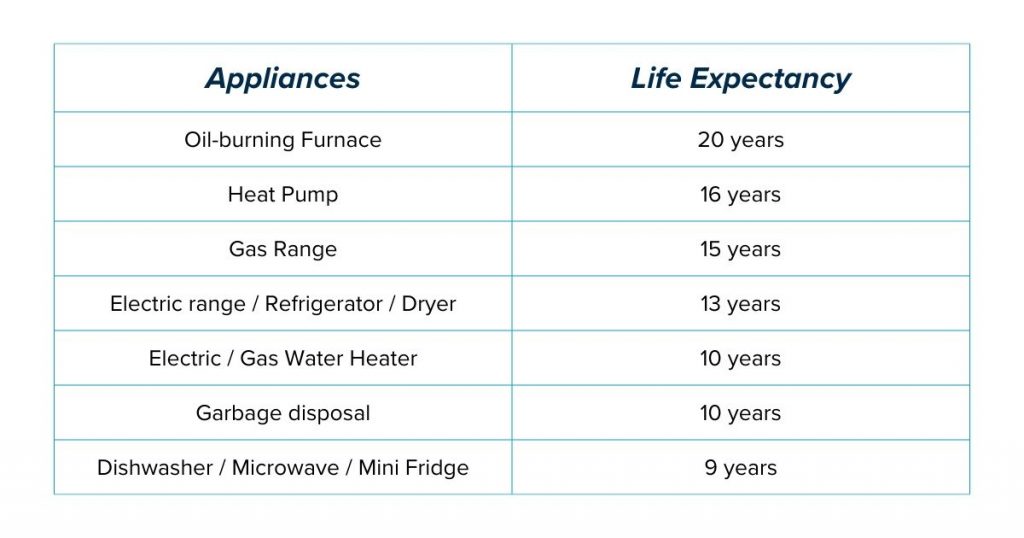
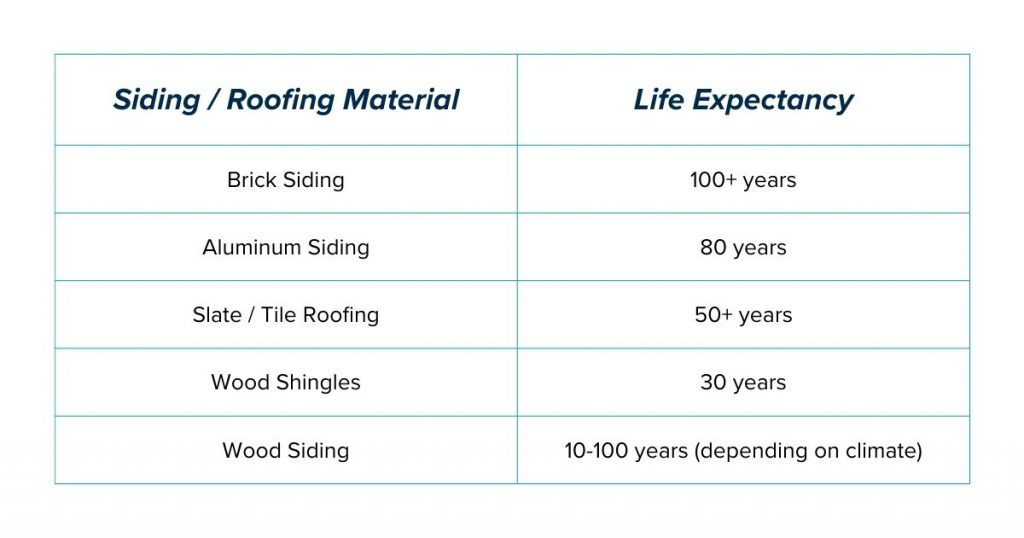
At a minimum, your new investment property should be safe and livable. This isn’t just the right thing to do, it will also shield you from liability and help attract better tenants. Start by repairing the necessities using your home inspection report as your guide. Prioritize issues that could lead to bigger problems down the road, such as a leaky roof or holes in the closet that could lead to infestations. Ensure that all appliances are in top working condition, including the furnace or other heating system, and that the plumbing and electrical are up to code.
Also make sure the property complies with all local and state laws regarding the presence of mold, lead paint, asbestos, and other potentially hazardous substances.
Choose a property management team
While you can manage the property yourself, hiring a good property management team will reduce stress and likely save money over time. Property managers handle tasks such as rent collection, maintenance, tenant screening, and marketing your property. They also oversee complaints, so you don’t have to deal with upset or difficult tenants.
To find a reliable property management team, start by asking for recommendations from friends, family, or other real estate investors. Also check reviews on specialized property review sites. When interviewing potential managers, ensure they have experience with properties like yours and assess their responsiveness and communication skills, as you need a manager who keeps you informed and addresses issues promptly.
If the management fee is too steep and you decide to go it alone, curate a list of reliable plumbers, electricians, appliance repair companies, and handymen to handle maintenance requests. Also thoroughly screen tenants to ensure they’re reliable and will take good care of your property.
Enhance the property appeal
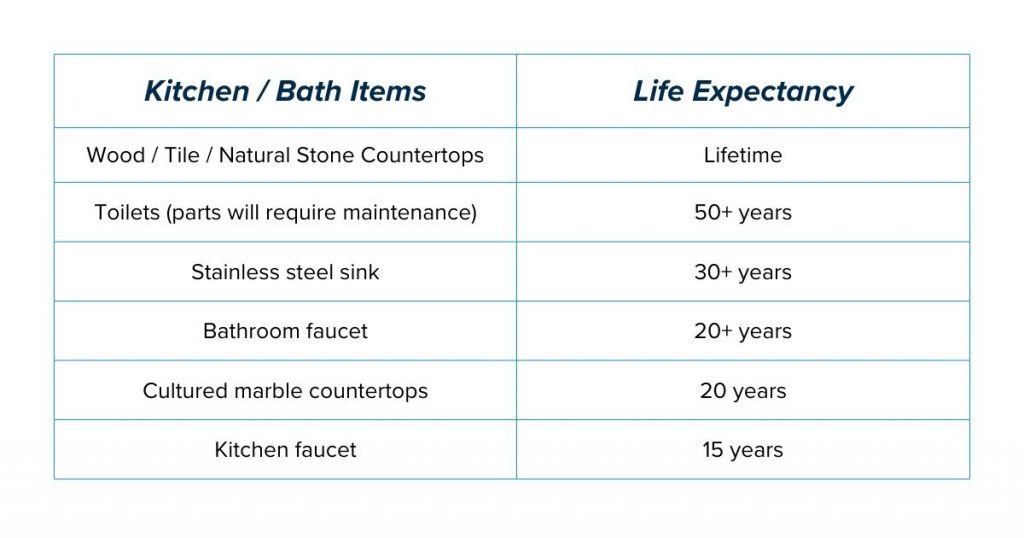
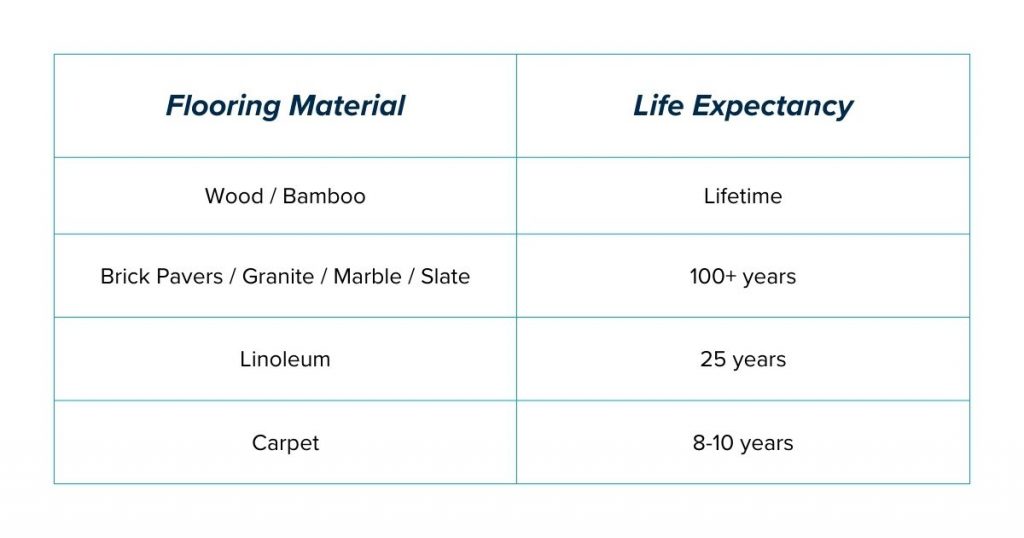
Before you rent the property, consider cost-effective renovations to enhance its appeal and rental value without breaking the bank. For the kitchen, consider refacing or repainting cabinets, upgrading to energy-efficient appliances, and installing modern faucets and light fixtures. Bathroom options include updating faucets, showerheads, and flooring. Other improvements that may attract higher-paying tenants include refinishing the floors, upgrading to energy-efficient doors and windows, and hiring a gardener to improve the landscaping.
Consider different rental strategies
Regular maintenance is crucial to maintain the property’s value and prevent costly repairs. Coordinate with your tenants to schedule periodic maintenance checks, and create a list of maintenance tasks to address when tenants are on vacation or between renters.
Property owners have traditionally concentrated on long-term rentals. However, the rise of short-term rental platforms like Airbnb and VRBO have shifted the landscape for some. Long-term rentals are idea for owners seeking a stable income, as turnover is typically low and monthly revenue is predictable. On the other hand, short-term rentals can command higher nightly rates, but they usually involve more expensive and time-consuming management and upkeep. Plus, reservations can be unpredictable, particularly in areas with seasonal fluctuations.
Set competitive rental rates
Property management teams generally recommend an optimal rent based on a comprehensive market analysis, helping you achieve the highest return on your investment. If you’re managing the property yourself, you can perform your own analysis by researching comparable properties (“comps”) on websites like Craigslist or Trulia. Consider factors such as your property’s location compared to the comps, and whether your property includes coveted features like air conditioning, a washer/dryer, or ample outdoor space. Proximity to good schools and local amenities such as restaurants are also valued by renters.
Keep in mind that for your investment to be profitable, your rental income must cover expenses such as mortgage payments, taxes, management fees, insurance, and ongoing maintenance costs. Make sure to periodically review and adjust the rates to remain competitive and maximize your income.
Market your property effectively
As with rental rates, your property management team typically lists and markets the property, so you’re off the hook here. However, if you’re managing solo, you need to think like a product marketer, using tools like high-quality photos, virtual tours, and compelling descriptions to make your property stand out. First impressions matter, so lead with a well-lit, inviting photo. Bright images convey a clean, move-in-ready home, while dark photos can scare tenants away by making the property appear dirty and uninviting. Consider hiring a professional photographer to ensure the lighting and framing are perfect in every room.
Review other listings to gather inspiration for your own. Highlight unique selling points over standard features, especially if the latter are evident in the photos. Think about what would attract you as a renter. Is it simply a garage with two storage cabinets? Or is it a spacious garage with a shop-ready layout, including two 220V circuits, two sturdy workbenches, and built-in storage?
Master the legal and financial details
Owning an investment property comes with legal rights and responsibilities for both you and your tenants. It’s crucial to familiarize yourself with local rental laws, zoning regulations, and tenant rights to prevent legal liabilities and handle any issues that may arise effectively. Additionally, obtaining landlord insurance is essential to protect against potential property damage and liability.
And remember, owning an investment property lets you take advantage of tax deductions for mortgage interest, property taxes, repairs, and depreciation. Keep detailed records of all income and expenses to ensure you maximize these deductions and continue to earn a profit.
SOURCE: Windermere

 Facebook
 X
X
 Pinterest
 Copy Link