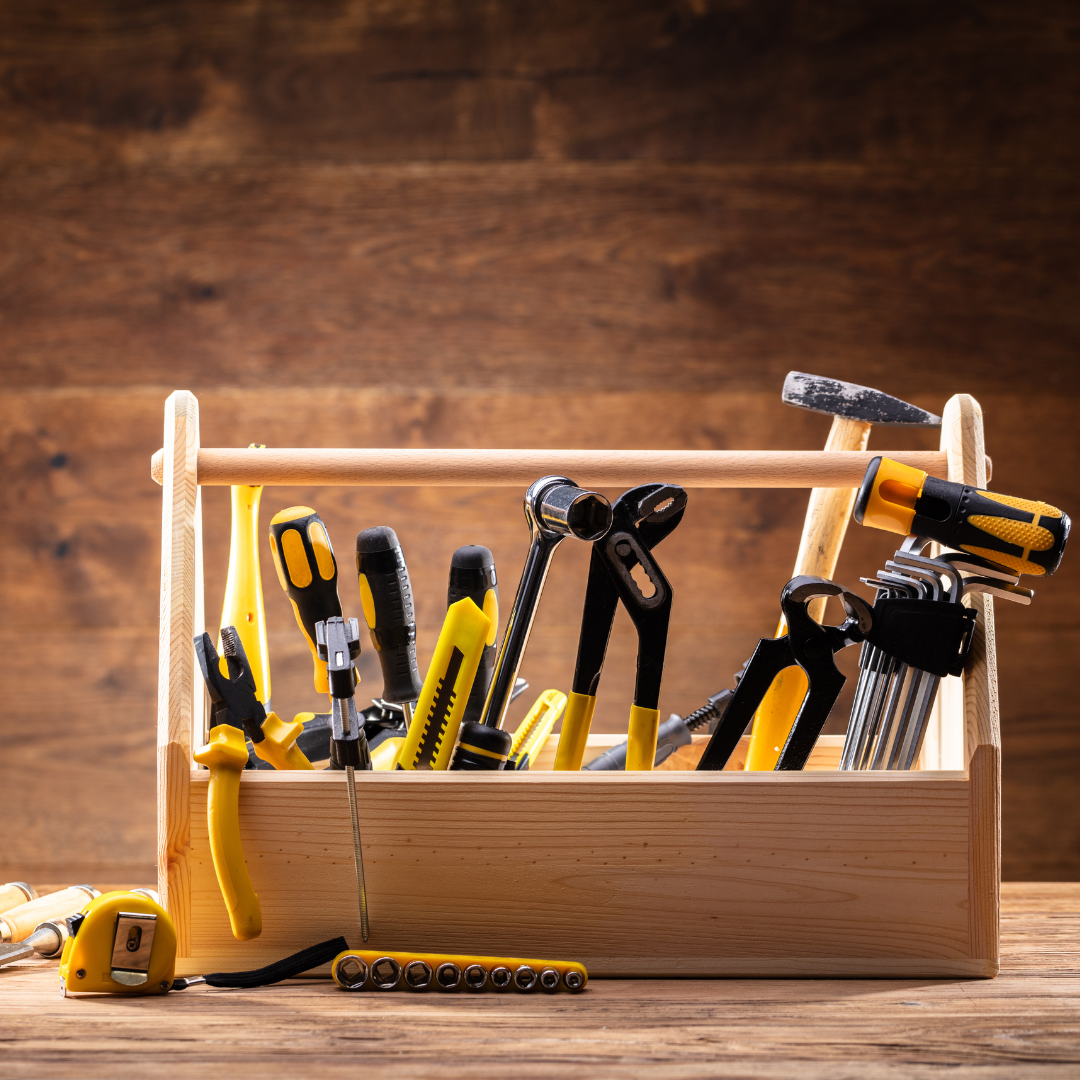
Market NewsMatthew Gardner September 26, 2023

How Low Inventory Is Affecting the Housing Market

Windermere Chief Economist Matthew Gardner demonstrates how the U.S. housing market is adapting to low inventory levels. He touches on the new construction industry, supply changes in large metro areas, median home sale prices, and more.

This video is the latest in our Monday with Matthew series with Windermere Chief Economist Matthew Gardner. Each month, he analyzes the most up-to-date U.S. housing data to keep you well-informed about what’s going on in the real estate market.


Low Inventory Housing Market

Hello there, I’m Windermere Real Estate’s Chief Economist Matthew Gardner and welcome to this month’s episode of Monday with Matthew. As we are all aware, the housing market has softened considerably with the number of existing homes available to buy close to record lows. Today we are going to talk about supply, and how the market is starting to adapt to low inventory levels.

Housing Market Inventory

A bar graph showing the average number of homes on the market in the U.S. from 2000 to 2023. A line crosses through the bar graph showing months supply. inventory peaked in 2007 at roughly 3.5 million homes for sale. In 2023, inventory rose above 1 million for the first time since 2020.


This chart shows the average number of homes on the market by year. Although year to date we have seen a little bit of an uptick, it’s clear the country remains supply-starved. And with just over three months of inventory—as opposed to the normal four to six—the market is clearly out of balance. But even though inventory levels have risen nationally, as I’ve said many times before, not all markets are equal.

Housing Inventory Changes in Metro Areas

A scatter plot showing the changes in inventory levels of homes for sale in different metropolitan areas throughout the U.S. from Q2 2019 to Q2 2022. Only Austin, Texas had more homes for sale higher in the second quarter of this year than it had in the second quarter of 2019.


This chart shows how supply levels have changed. The data here is representative of the 100 largest metropolitan areas in the country. The horizontal axis shows the change in inventory versus the second quarter of 2022, while the vertical axis shows the difference and the number of homes for sale versus the second quarter of 2019. I think you’ll agree that the difference is stark. Although two-thirds of the metropolitan areas have seen the number of homes for sale improved versus the same period a year ago, just one (Austin, TX) had more homes for sale higher in the second quarter of this year than it had in the second quarter of 2019.

  • And even more stark was the fact that inventory levels in 53 of the 100 largest metropolitan areas were down by more than 50% compared to the same period three years ago.

Interestingly, on a percentage basis, smaller metro areas saw the greatest decline compared to three years ago. For example, in Hartford, CT, the average number of homes on the market in the second quarter was just over 900, down by 80% from the second quarter of 2019 where there was an average of over 4,400 units for sale. Supply levels were down by 78% in Stamford, CT; 75% in New Haven, CT; and 74% in Allentown, PA.

It is true that supply levels are generally higher when compared to a year ago, with the greatest increase being seen in select markets in Florida, Tennessee, Texas, and Oklahoma; however, other than in Austin, supply levels remain well below their long-term averages. So, how is the market adapting? The answer is rather interesting. Even with all the talk of escalating material, land, and labor costs, it’s the new home industry that has been taking advantage of the lack of housing supply.

New Construction Market Trends

A line graph showing the share of new construction homes compared to single-family homes being resold from 1983 to 2023. The most significant portion of the graph is the steady increase from roughly 5% in 2011 to nearly 35% in 2023. In conclusion, new construction homes have a growing market share.


This chart shows the share of new homes on the market compared to their resale counterparts—here we are just looking at single-family homes. Historically, new construction makes up roughly 10% of active listings at any one time, but as you can see here, that share has been rising not just since the end of the pandemic but for the past several years. Although off the high seen a few months ago, 30% of the single-family homes for sale this July were brand new. I find this particularly interesting because, historically speaking, a premium was paid in order to buy a new home rather than an existing one.

Median Sale Prices: New and Existing Homes

A double line graph showing median sale prices for new and existing homes from 1990 to 2022. The new homes line is consistently above the existing homes line. Both lines started around $100,000 in 1990 and in 2023, reached $455,800 for new homes and $392,800 for existing homes.


  • As you can see here, the spread in median sale prices, which was pretty stable from 1990 until the bursting of the housing bubble, grew significantly starting in 2011 and in 2022. The premium averaged 16%. But when we look a bit closer at the numbers, they gives us a somewhat different picture.


A double line graph showing median sale prices for new and existing homes from January 2012 to January 2023. The new homes line is consistently above the existing homes line. In 2023, the spread has dropped to just 6%. In June of this year the difference was only $1,000.


  • You can see here the spread has dropped to just 6%. And in June of this year, the difference was a mere $1,000.

With the share of new homes for sale holding at a four-decade high, the share of sales themselves is at a level we haven’t seen since 2005. But even though we know that there is demand for housing, shouldn’t sales be constrained by mortgage rates? Well, what is happening is that builders are attracting buyers through incentives, and here we’re talking about mortgage rate buydowns which are becoming increasingly prevalent across the country.

In fact, a recent survey from John Burns Consulting suggested that 30% of home builders reported using interest buydowns more in the second quarter of this year than they had previously. And this is attracting buyers to visit new development communities.

An example of these buydowns is the 2/1 program that DR Horton—the largest home builder in the country—is offering at some communities. This program gives buyers a mortgage rate that starts at 3% for the first year, rises to 4% in year two, and then goes to 5% for the balance of the 30-year term. That’s pretty compelling, given where mortgage rates are today.

The bottom line is that as far as I can see, the new home industry will continue to take an outsized share of the market for the balance of 2023 and likely through most of 2024. That said, once the market starts to normalize, I expect them to pull back from these incentive programs, making them more likely to start raising asking prices, and we will return to the traditional spread between the prices of new and resale homes.

Although it’s pleasing to see more homes being built, I still believe that the country will still be running a housing deficit when it comes to meeting demographic demand and this will continue to hurt first-time buyers who continue to be priced out of the market.

As always, I’d love to hear your thoughts on this subject so feel free to leave your comments below. Until next month, stay safe out there and I’ll see you soon. Bye now.

To see the latest real estate market data for your area, visit our Market Update page.


About Matthew Gardner

As Chief Economist for Windermere Real Estate, Matthew Gardner is responsible for analyzing and interpreting economic data and its impact on the real estate market on both a local and national level. Matthew has over 30 years of professional experience both in the U.S. and U.K.

In addition to his day-to-day responsibilities, Matthew sits on the Washington State Governors Council of Economic Advisors; chairs the Board of Trustees at the Washington Center for Real Estate Research at the University of Washington; and is an Advisory Board Member at the Runstad Center for Real Estate Studies at the University of Washington where he also lectures in real estate economics.

Selling September 12, 2023

Understanding Contingent Offers: A Seller’s Guide

Whether you’ve listed multiple homes or you’re a first-time home seller, you’ve likely come across the word “contingent” before. Contingent home sales, though very common, aren’t as simple as a real estate transaction without them. With contingencies, there are additional factors at play and added criteria that need to be met for the deal to go through. As a seller, being aware of these offers will help to inform your discussions with your agent once you know it’s time to sell your home.

What is a contingent offer?

Contingent offers in real estate give the buyer or seller the right to back out of the contract if the conditions aren’t met. There are different types of contingencies that determine what must happen for the deal to go through, which means buyers have options. Depending on their situation, whether they are selling their current home while making an offer on yours, unsure whether they can secure the right financing, or want to wait for the results of the home inspection before finalizing their offer, they’ll explore contingencies with their real estate agent as they build their offer.

This may feel a bit like buyers want to have their cake and eat it too, but every homeowner can understand the desire to protect their investment before fully diving in. In a seller’s market, there are fewer homes available, which means buyers will do whatever they can to make their offer stand out. Because sellers have the leverage in these market conditions, you’ll often see buyers waiving their contingencies. Talk to your agent for more information about the local market conditions in which you’re selling.

Should I accept a contingent offer on my house?

Each home sale is different, and each seller has a unique story. What you’re looking for in an offer may be different from what someone else in your neighborhood is looking for when selling their home. It all depends on your circumstances, your timeline, your next steps, and your local market conditions. The extra stipulations in a contingent offer require the attention of an experienced real estate agent who can interpret what they mean for you as you head into negotiations.

  • How to Negotiate as a Seller

How often do contingent offers fall through?

Contingent offers can fall through more often than non-contingent ones, but there’s no general rule of thumb. Whether a sellers and buyer are able to agree on the terms of a deal is a case-by-case situation. Different contingencies may carry different weight among certain sellers, and local market conditions usually play a significant role. For up-to-date information about your local market, visit the Market News category of our blog.


A young heterosexual interracial couple shake hands with their real estate agent in an office as they accept a contingent offer for their home.

Image Source: Getty Images – Image Credit: jacoblund


Pros and Cons of Contingent Offers for Sellers

Pros: Accepting a contingent offer means you don’t have to take your home off the market quite yet, since the conditions of the deal haven’t been met. If the buyer backs out of the deal, you can sell without having to re-list. In certain cases, some buyers may be willing to pay extra to have their contingent offer met.

Cons: Home sales with contingent offers are usually slower than those without. It takes time to satisfy a buyer’s contingencies and additional time to communicate that they have been met. And of course, there’s always the risk that the deal could fall through.

Connect with me for guidance when facing contingent offers.

Design August 29, 2023

5 Features of Mediterranean Interior Design

There’s so much beauty in the countries that border the Mediterranean Sea, it’s no wonder the design style derived from this area of the world has the same effect on a home’s interior. Mediterranean interior design, part of the larger coastal design family, creates interiors that harmonize with the outdoors. Here are a few of its most common features.

5 Features of Mediterranean Interior Design

1. Mediterranean Materials

This style borrows primarily from the longstanding traditions found in Greece, Spain, and Italy, with additional influence from Mediterranean countries like Morocco and France. People have lived in this area of the world for thousands of years, each civilization attaining high levels of achievement in art and culture. Accordingly, the common materials that make up this interior design style show a timeless appeal. Dark wood, marble, or terra cotta tile are popular flooring choices, while the walls are typically made of stucco or plaster.


A Mediterranean interior design style bathroom with typical coastal design elements like marble tile, minimal accessories, and natural décor.

Mediterranean interior design bathroom | Image Source: Getty Images – Image Credit: FollowTheFlow


2. Mediterranean Color Palette

Prepare to be inspired. The colors found in a typical Mediterranean palette are tailor-made to make your interior come to life. Each hue is a rich variation of the colors we’re most familiar with in interior design. Golden yellows, olive greens, rich reds, and cobalt blues form the basis of the Mediterranean style. These colors all pop against a white stucco backdrop and evoke liveliness while being grounded in natural and organic elements like the sun, trees, and water.


A Mediterranean interior design style bedroom with typical coastal design elements like stucco and natural décor.

Mediterranean interior design bedroom | Image Source: Getty Images – Image Credit: amriphoto


3. Harmony with Nature

The ultimate Mediterranean interior is at one with nature; it’s somewhere you can walk around barefooted while a gentle breeze blows through the room. From its exposed wood beams to natural stone walls, everything about Mediterranean interior design embraces the outdoors and the elements derived from it. Open-air patios are often the central entertaining space, putting an emphasis on indoor-outdoor living.


A Mediterranean interior design style living with typical coastal design elements like exposed beams, a connection to the outdoors, and natural décor.

Mediterranean interior design living room | Image Source: Getty Images – Image Credit: Julieanne Birch


4. Mediterranean Decorative Elements

Overall, Mediterranean design takes a less-is-more approach to home décor. Relying on the natural beauty of its elements, its philosophies on design have more in common with mid-century modern interior design than, say, eclectic style. Common decorative items include textured walls, tapestries, mosaic inlays, and Italian-style pottery and art. The countries that form the inspiration for Mediterranean style all have their unique take on sculpture art, commonly found in historical buildings and traditional architecture. Accordingly, sculpted detailing is a fitting décor feature in this style.

5. Bringing People Together

At the end of the day, people are an important part of Mediterranean interior design. Family spaces are a priority, as are communal seating arrangements in areas like the living room, dining room, and outdoor patio. Once you design your home this way, you can’t help but invite family and friends over to celebrate together. The open spaces and natural elements create a welcoming environment that is meant to be shared. Happy hosting!

Market NewsMatthew Gardner August 22, 2023

U.S. Home Prices and Housing Affordability in 2023

Windermere Chief Economist Matthew Gardner gives an updated look at U.S. home prices and housing affordability in 2023 by examining two key second-quarter reports from ATTOM Data Solutions and the National Association of Home Builders (NAHB).

This video is the latest in our Monday with Matthew series with Windermere Chief Economist Matthew Gardner. Each month, he analyzes the most up-to-date U.S. housing data to keep you well-informed about what’s going on in the real estate market.


U.S. Home Prices 2023

Hello there, I’m Windermere Real Estate’s Chief Economist Matthew Gardner and welcome to this month’s episode of Monday with Matthew. Today we are going to look at home prices and housing affordability. To do this I will be looking at the second quarter sales price data from ATTOM Data Solutions and we will also look at the just released National Association of Home Builders Housing Opportunity Index for the second quarter.

Are home prices dropping?

A map of the United States showing the year-over-year change in median sales price from Q2 2022 to 2023. Iowa had the largest positive change at 10.4%, while New York state had the greatest decline at -8.1%.


Starting with the year-over-year change in sale prices at the state level, there aren’t any great surprises. For the past several months I’ve been saying that as the Western U.S. saw the greatest price growth during the pandemic, so it’s not surprising to see most states sale prices in the quarter below the level seen a year ago. But it was pleasing to see that sale prices in 36 states either matched the level seen a year ago or were higher, and in some instances quite significantly so.

U.S. Home Sale Prices 2023 By State

A map of the United States showing the percentage change of home sales prices from their 2022 peak. 33 states are at or above their peak last year, but most of the Western states have yet to recover. Louisiana, Hawaii, and New York are lagging the most.


And when we compare second quarter sale prices to their 2022 peaks, 33 states are at or above the highs seen last year, but most of the Western States have yet to fully recover. In the South, Louisiana is still lagging by a good amount, as is New York State on the East Coast.

But as you are all very aware, all markets are different. I thought it would be interesting to dig a little deeper into the data to see which metro markets have seen significant gains over the past 12 months. It’s going to be interesting specifically because of the fact that mortgage rates have risen so much.

Metro Areas: Home Sale Prices 2023

A map of the United States showing specific metro areas throughout the Eastern U.S. that are above their 2022 peak in terms of home sale prices. Macon, GA is up 13.4%, while Roanoke is up 9.1%.


These are markets where sale prices are far above their 2022 peak sale prices. Now I must add that I only looked at markets where more than 1,000 transactions occurred in the last quarter, which takes out some of the volatility. Notably, even though the state of Virginia’s home prices in the quarter were flat when compared to their 2022 peak, the Roanoke market was up by over 9%. And in Pennsylvania, where state prices were only 1.2% above their 2022 peak, Reading is up by 7.6% and York by 7.4%. And in Georgia, where state sale prices were up a modest 1.6%, homes in Macon have leapt by over 13% and prices are up by 6.9% in Savannah.


A map of the United States showing specific metro areas throughout the country that are below their 2022 peak in terms of home sale prices. California has three metro areas highlighted, the lowest of which is San Francisco at -10.5%. Austin, TX is at -10.9% and Shreveport, LA is at -17.8%.


But, on the other end of the spectrum, there are markets which are underperforming their respective states and, unsurprisingly, California tops the list with three of their metros seeing prices significantly below that of the state as a whole. In other parts of the country, several metro areas which were relatively affordable before the pandemic saw an influx of remote workers and this led prices to skyrocket, and these will take some time to recover. This is particularly true in the Austin and Boise market areas.

I would add that, of the counties across the country where there were more than 1,000 transactions in the second quarter, half have met or exceeded their prior peak and—of the half where sale prices were still lower—the average shortfall is only around 4% and there are just seven counties in the country where sale prices are down by more than 10% from their 2022 peaks.

Now, what I see in the data is that the U.S. housing market, although certainly not fully healed, is headed in the right direction even when faced with mortgage rates that remain remarkably high. So, with sale prices recovering and still faced with stubbornly high financing costs, what does affordability look like?

U.S. Housing Affordability 2023

Well, according to the National Association of Homebuilders (NAHB), of the 241 metros that they track, just 40.5% of sales in the second quarter were affordable to households making the area’s median income—that’s the second lowest share of sales seen since they started generating this dataset a decade ago. Now, their data does go back to 2004, but the interest rate series that they used to use was discontinued, so it’s not accurate to compare their data today with anything before 2012.

Most Affordable U.S. Housing Markets

A map of the United States showing the most affordable housing markets according to Q2 2023 data. All markets are on the eastern side of the country. Cumberland, MD has the highest affordability rate at 93.5%, followed by Elmira, NY at 92.8%.


These were the most affordable markets in the second quarter and their locations should not be of any great surprise. Average sale prices in these markets were measured around $203,000—that’s just marginally above 50% of the national sale price in the quarter, which was $402,600.

Least Affordable U.S. Housing Markets

A map of California showing some of the least affordable housing markets in the United States. Los Angeles is the least affordable at 4.1%, followed by Anaheim at 5.7% and Napa at 6.6%.


And unfortunately this should not surprise you either. On the other end of the spectrum, the top-10 least affordable housing markets were all in California, but it gets worse than that. The top 15 least affordable markets again, all in California, and 19 out of the top 25 were in the Golden State!

As far as I can see, the ownership housing market is still showing remarkable resiliency, especially given that mortgage rates have more than doubled from their lows and they’ve risen from 4.8% at the start of the second quarter of last year to 7% at the end of the second quarter of 2023.

Now, I still expect to see rates starting to slowly move lower as we go through the second half of the year. This will help with prices and, to a degree, affordability, but until we see a significant increase in the number of homes listed for sale, the market is going to remain unbalanced.

As always, I’d love to hear your thoughts on this subject so feel free to leave your comments below. Until next month, stay safe out there and I’ll see you soon. Bye now.

To see the latest real estate market data for your area, visit our quarterly Market Updates page.


About Matthew Gardner

As Chief Economist for Windermere Real Estate, Matthew Gardner is responsible for analyzing and interpreting economic data and its impact on the real estate market on both a local and national level. Matthew has over 30 years of professional experience both in the U.S. and U.K.

In addition to his day-to-day responsibilities, Matthew sits on the Washington State Governors Council of Economic Advisors; chairs the Board of Trustees at the Washington Center for Real Estate Research at the University of Washington; and is an Advisory Board Member at the Runstad Center for Real Estate Studies at the University of Washington where he also lectures in real estate economics.

Living August 11, 2023

How to Create a Balcony Garden

Gardens come in all shapes and sizes. For those who don’t have a flourishing backyard with acres of greenery, you’ve got to make do with the space you have to satisfy your inner green thumb. Creating a balcony garden can bring life to your terrace and give you some healthy options to add into your cooking. By plotting out the space, researching which plants will thrive on your balcony, and gathering the right materials, you’ll set yourself up for gardening success.

How to Create a Balcony Garden

First, consider your space. The amount of sunlight your balcony gets will determine what you’re able to grow and how quickly your garden will grow. Crops like tomatoes and strawberries need lots of sun to grow up healthy, while others like peas and herbs can still thrive in less sunlight. If your balcony is sunlight-deprived, you may need to invest in a grow light to give your plants the light they need.

What are your goals for your balcony garden? Are you looking to build out your collection of natural herbs or do you want to turn your terrace into your own personal exotic oasis? Whether your motives are culinary or aesthetic, planning out your garden will help you maximize space. Hanging and stack planters allow you to create a vertical garden, which helps save space. Climbing plants like honeysuckle, ivy, ferns, and different varieties of vines are perfectly suited for this kind of garden design. Before hanging any planting pots, hooks, trellises, shelves, or any kind of gardening equipment, check your governing Homeowners Association (HOA) policies to make sure your plans are within the rules.


A young woman replants plants on her balcony garden.

Image Source: Getty Images – Image Credit: AleksandarNakic


Keep Your Plants Healthy

With any garden, your main concern is keeping your plants healthy. This means giving them plenty of water, treating your soil with care, and keeping up with seasonal demands depending on your local climate. If you’re looking to save money on your balcony gardening project, don’t focus your frugal efforts on soil. Soil is the lifeblood of your garden, so it’s important to give it a fresh, nutrient-rich mixture. Once you’ve selected your plants, research their needs to see which potting mix you need to pick up at your local gardening or hardware store. Depending on the chemical makeup of the potting soil, you may not need to fertilize your plants right away.

With a balcony garden, it’s also important to keep your neighbors happy. Put saucers underneath your pots to prevent excess water from dripping onto the neighbors beneath you. This will also cut down on wasted water, one of the main principles of sustainable gardening. Self-watering pots are helpful, especially if you’re not always around to water your plants. They prevent overwatering by metering the amount of water your plants receive, only feeding them when necessary.

You also need to consider how much weight you’re adding to your balcony. Yes, terra cotta pots have that quintessential Tuscan gardening look, but a dozen ceramic pots filled with water-soaked plants might bear more weight on your terrace than it’s prepared for. Look at more lightweight potting alternatives and different soil mixtures than can lighten the load on your balcony.

Market NewsMatthew Gardner July 28, 2023

Q2 2023 Western Washington Real Estate Market Update

The following analysis of select counties of the Western Washington real estate market is provided by Windermere Real Estate Chief Economist Matthew Gardner. We hope that this information may assist you with making better-informed real estate decisions. For further information about the housing market in your area, please don’t hesitate to contact your Windermere Real Estate agent.


Regional Economic Overview

As discussed in the first quarter Gardner Report, job growth continues to slow. Even though Western Washington added 54,391 new jobs over the past 12 months, which represented a decent growth rate of 2.3%, the slowdown in the creation of new jobs is palpable. The regional unemployment rate in May was 3.7%, which is marginally above the 3.4% of a year ago. As we enter the summer months, I have started to ponder the economic outlook for the balance of this year as well as looking ahead to 2024. Although many are still suggesting a looming recession, I remain unconvinced. However, if enough people expect to see an economic contraction, it can become a self-fulfilling prophecy, which has happened in the past!

Western Washington Home Sales

❱ In the second quarter of 2023, 14,997 homes sold. This was down 34.4% from the second quarter of 2022, but up 43.8% from the first quarter of 2023.

❱ The growth in quarter-over-quarter sales was due to the 21.7% increase in the number of homes for sale. While this is positive, it should be noted that inventory levels in the quarter were still 16% lower than a year ago.

❱ Sales fell across the board compared to the same quarter in 2022 but were up in all markets compared to the first quarter of 2023.

❱ Pending sales rose in all counties compared to the first quarter of this year, suggesting that sales in the upcoming quarter may show further improvement.

A graph showing the annual change in home sales by county for Western Washington from Q2 2022 to Q2 2023. Clallam had the lowest change at -5%, while Snohomish had the highest at 41.8%. Counties like Whatcom and Grays Harbor were in the middle at around 28%, while King county had the second largest change at -35.8%.

Western Washington Home Prices

❱ Sale prices fell an average of 7.6% compared to the second quarter of 2022 but were 11.7% higher than in the first quarter of this year. The average home sale price was $773,343.

❱ Compared to the first quarter of this year, sale prices were higher in all counties except San Juan, which, as a small island county, is notorious for its extreme price swings.

❱ The year-over-year drop in sale prices was not a surprise given that the market was peaking due to rapidly rising mortgage rates. That said, prices in Lewis, Clallam, and Skagit counties exceeded those of a year ago.

❱ It was interesting to see list prices rising in all markets compared to the first quarter of the year. Even though inventory levels have risen, sellers still believe that they are in the driver’s seat.

A map showing the real estate home prices percentage changes for various counties in Western Washington. Different colors correspond to different tiers of percentage change. San Juan County has a percentage change in the -16% to -13.1% range, Whatcom, Snohomish, King, Mason, and Jefferson are in the -10% to -7.1% change range, Pierce is in the -7% to -4.1% change range, and Lewis, Skagit, Clallam, Grays Harbor, Kitsap, and Thurston are in the -4%+ change range.

A bar graph showing the annual change in home sale prices by county in Western Washington from Q2 2022 to Q2 2023. Lewis County tops the list at 2.1%, while San Juan county had the greatest decline at -15.8%. Pierce and King County were toward the middle at around 7%, while Snohomish County had the second greatest decline at -9.8%.

Mortgage Rates

Although they were less erratic than the first quarter, mortgage rates unfortunately trended higher and ended the quarter above 7%. This was due to the short debt ceiling impasse, as well as several economic datasets that suggested the U.S. economy was not slowing at the speed required by the Federal Reserve.

While the June employment report showed fewer jobs created than earlier in the year, as well as downward revisions to prior gains, inflation has not sufficiently slowed. Until it does, rates cannot start to trend consistently lower. With the economy not slowing as fast as expected, I have adjusted my forecast: Rates will hold at current levels in third quarter and then start to trend lower through the fall. Although there are sure to be occasional spikes, my model now shows the 30-year fixed rate breaking below 6% next spring.

A bar graph showing the mortgage rates from Q2 2021 to the present, as well as Matthew Gardner's forecasted mortgage rates through Q2 2024. After the 6.79% figure in Q4 2022, 6.35% in Q1 2023, and 6.51% in Q2 2023, he forecasts mortgage rates going to 6.55% in Q3 2023, 6.31% in Q4 2023, 6.03% in Q1 2024, and 5.72% in Q2 2024.

Western Washington Days on Market

❱ It took an average of 35 days for homes to sell in the second quarter. This was 20 more days than in the same quarter of 2022, but 21 fewer days compared to the first quarter of this year.

❱ Snohomish County became the tightest market in Western Washington, with homes taking an average of only 18 days to sell. Homes for sale in San Juan County took the longest time to sell at 81 days.

❱ All counties contained in this report saw average days on market rise from the same period in 2022. Market time fell across the board compared to the prior quarter.

❱ The greatest fall in days on market compared to the first quarter was in Clallam County, where market time fell 31 days. Also of note were Pierce, Thurston, and Whatcom counties, where market time fell 25 days.

A bar graph showing the days on market by county for homes in Western Washington in Q2 2023. Snohomish County had the lowest DOM at 18, while San Juan had the highest at 81. Whatcom, Skagit, and Jefferson counties were in the middle at around 30, while King county had the second lowest DOM at 19.

Conclusions

This speedometer reflects the state of the region’s real estate market using housing inventory, price gains, home sales, interest rates, and larger economic factors.

The increase in listing activity, while pleasing, still leaves the market short of inventory. Even with mortgage rates well above levels we’ve seen over the past few years, demand for homes still exceeds supply. Given that over 86% of homeowners with mortgages have an interest rate below 5% and more than a quarter have a rate at or below 3%, I see little incentive for them to sell if they don’t have to. This tells me that supply levels are unlikely to improve enough to meet demand until rates drop significantly.

A speedometer graph indicating a seller's market leaning toward a balanced market in Western Washington for Q2 2023.

With this supply-demand imbalance, it’s no surprise that prices are rising again following the decline in the second half of 2022. I expect prices to rise modestly as we move through the second half of 2023. Rising list and sale prices, shorter time on market, and higher pending and closed sales all offset higher mortgage rates. Given these factors, I have moved the needle in favor of sellers.

About Matthew Gardner

Matthew Gardner - Chief Economist for Windermere Real Estate

As Chief Economist for Windermere Real Estate, Matthew Gardner is responsible for analyzing and interpreting economic data and its impact on the real estate market on both a local and national level. Matthew has over 30 years of professional experience both in the U.S. and U.K.

In addition to his day-to-day responsibilities, Matthew sits on the Washington State Governors Council of Economic Advisors; chairs the Board of Trustees at the Washington Center for Real Estate Research at the University of Washington; and is an Advisory Board Member at the Runstad Center for Real Estate Studies at the University of Washington where he also lectures in real estate economics.

Market NewsMatthew Gardner July 24, 2023

Housing Market 2023: Home Prices, U.S. Demographics, and More

Harvard University’s latest edition of “The State of the Nation’s Housing” has arrived, and Windermere Chief Economist Matthew Gardner is here to break down what the data presented in the report means for the U.S. housing market in 2023 and beyond.

This video is the latest in our Monday with Matthew series with Windermere Chief Economist Matthew Gardner. Each month, he analyzes the most up-to-date U.S. housing data to keep you well-informed about what’s going on in the real estate market.


Housing Market 2023

Hello there, I’m Windermere Real Estate’s Chief Economist Matthew Gardner, and welcome to this month’s episode of Monday with Matthew. I spend a lot of time reading reports that relate to the housing market, but there is one in particular I’m always impatiently waiting for, and it’s published by my colleagues at the Joint Center for Housing Studies at Harvard University. Every year they release the The State of the Nation’s Housing report and it’s packed full of fascinating data about the ownership and rental housing markets, demographics, and it also discusses the challenges that lay ahead. So today, I wanted to touch briefly on just a few of the report’s high points, but I highly recommend you download it from their website.

What’s happening in the housing market?

A double line graph showing home price and apartment rent growth from 2004 to 2023. The year-over-year changes were stable between 2011 and 2020, rising to roughly 20% YOY by 2022 and have declined sharply during the past year. Housing market 2023.


As we all know, the for-sale housing market started softening in mid 2022 in response to rising interest rates and deteri­orating affordability. What was particularly notable was that season­ally adjusted home prices fell month over month last July and that was the first monthly drop in over a decade. And over in the rental market, asking rents—while still up year over year—also saw their pace of growth slow considerably, and that is a concern.

Is home construction slowing down?

A line chart showing the number of single-family homes under construction from 1970 to 2022. After a steady increase from 2010 to 2022, single-family construction has dropped dramatically while multifamily development has remained strong. Housing market 2023.


As you see here, multifamily construction continued to rise last year even as rental demand was softening. In fact, 547,000 new multifamily units were started in 2022, the highest number since the mid-1980s, and the 960,000 units under construction in March 2023 was the highest number seen in half a century. On the ownership side, it wasn’t surprising to see single-family construction falling significantly as buyers reacted to sharply higher borrowing costs.

The report also suggested that the decline in new construction was particularly acute for lower-priced homes. Builders just can’t produce entry-level product with current material, labor, and land costs; limited lot availability; and regulatory barriers such as minimum lot sizes that restrict production of entry-level housing production.

U.S. Population Demographics

A bar graph showing the annual population change in millions from 2011 to 2022. Both the natural population change and net immagration steadily decreased from 2014 to 2021 before rebounding slightly in 2022.


Now turning to demographics. Population growth—naturally the primary long-term driver of household growth—remains historically low. Overall, the U.S. population grew by 1.26 million people last year, or just 0.38%. Now, while this does represent a slight uptick from previous years that’s really not saying much as U.S. population growth hit 100-year lows in 2019, 2020, and 2021.

Increases in a country’s population come in two ways. The first is “natural” growth—which equals the number of persons born minus the number that have died—and the second is via immigration. Now, gains from immigration can be fickle because they are subject to unpredictable government policy changes as well as economic cycles here in the U.S. as well as in other countries. But natural growth is more predict­able because it is driven by slow-moving factors like birth and mortality rates. Until last year, natural growth had been the primary source of population growth in the U.S., but, as you saw in that last chart, things have shifted.

U.S. Population Growth & Migration

A map of the United States showing the counties with the greatest natural growth. There are many in Southern California, a few in western Washington Stage, a cluster in east Texas, and various counties spread throughout the Midwest and East Coast.


This map shows counties with the highest level of natural growth and it’s dominated by large metro markets in California, Texas, Southern Florida and parts of the Northwest. But, what I found very interesting was that the numbers were remarkably low. Only six counties—three in California, two in Texas, and one in New York—saw natural growth above the 10,000 level and 75% of counties across the country saw negative natural growth.


A map of the United States showing the counties with the greatest domestic migration. There are many in Florida and other states along the East Coast. There are several clusters throughout the Mountain West as well as a handful in East Texas.


So with natural growth slowing, states will understand the importance of attracting new residents from other markets as domestic migration will become a more important driver of household growth and housing demand. Here you see that Maricopa County, AZ saw the largest gains from domestic migration but, statewide, Florida dominated last year with 319,000 people moving there. Texas came in second with a net gain of over 230,000 people. But on the other end of the spectrum, California was the biggest loser with net 343,000 people leaving, followed by New York who lost 300,000 residents.


A map of the United States showing the counties with the greatest international migration. There are several counties represented in western Washington State, southern California, southwestern Arizona, and south Florida. There are a few dozen counties scattered throughout the Northeast.


It was international migration that accounted for a full 80% of total growth last year and it was the largest source of total population growth for 26 states and 29% of all counties across the country. The biggest winners were LA County in California, Miami-Dade County in Florida, and Harris County, Texas.

These were just some of the highlights of the report and the biggest conclusions I found were that, in the ownership market, supply will remain tight in the resale arena and new construction will not fill that void, especially as it comes to the entry level product. Housing affordability will not improve. This will continue to be a big issue across the country.

An oversupply of apartments coming online will further moderate rents, but renters will also find affordability to be a big concern. Demographic trends suggest that low domestic population growth going forward will lower new household formations and it’s quite likely that population and household growth will start to rely wholly on immigration earlier than the government expects.

So, there you have it. As always, I’d love to hear your thoughts on this subject so feel free to leave your comments below. Until next month, stay safe out there and I’ll see you soon. Bye now.

To see the latest real estate market data for your area, visit our quarterly Market Updates page.


About Matthew Gardner

As Chief Economist for Windermere Real Estate, Matthew Gardner is responsible for analyzing and interpreting economic data and its impact on the real estate market on both a local and national level. Matthew has over 30 years of professional experience both in the U.S. and U.K.

In addition to his day-to-day responsibilities, Matthew sits on the Washington State Governors Council of Economic Advisors; chairs the Board of Trustees at the Washington Center for Real Estate Research at the University of Washington; and is an Advisory Board Member at the Runstad Center for Real Estate Studies at the University of Washington where he also lectures in real estate economics.

Market NewsMatthew Gardner June 29, 2023

2023 Top 10 Predictions | Mid-Year Update

Windermere Chief Economist Matthew Gardner revisits his Top 10 Predictions for 2023. Reviewing his forecasts for home prices, mortgage rates, and more, he highlights recent changes in the real estate market and updates his predictions for the near future.

This video is the latest in our Monday with Matthew series with Windermere Chief Economist Matthew Gardner. Each month, he analyzes the most up-to-date U.S. housing data to keep you well-informed about what’s going on in the real estate market.


Top 10 Real Estate Market Predictions 2023 | Mid-Year Update

Hello there, I’m Windermere Real Estate’s Chief Economist Matthew Gardner and welcome to this month’s episode of Monday with Matthew. You may remember that at the end of last year, I published my Top-10 Predictions for 2023 and, as we hit the mid-year mark, some of you have been asking me how well my forecasts have been holding up. So, I thought it would be interesting to take another look at them to see how accurate they have or have not been! These were the predictions I made last November, and they covered everything from my expectations for home sales and prices to shifting government policies.

U.S. Home Sale Prices

A line graph showing the year-over-year U.S. home sale prices from May 2022 to April 2023. The YOY price change drops from 15% to below 0%, while the MOM price change oscillates between roughly 4% and -4.5%, bottoming out in July of 2022.


My first forecast suggested that sale prices would fall in 2023; however, I was not expecting any sort of systemic decline in values. Here you can see that year-over-year prices are down by a bit less than 2%, but when you look at how prices have changed month over month, they rose by 3.6% in April and are up by more than 6% since the end of last year.

I stand by my forecast that the median sale price in 2023 will be modestly lower than the 2022 number; and the monthly increase in sale prices that we have seen so far this year also supports my forecast that we are not seeing any long-term decline in home values.

2023 Mortgage Rates

A line graph showing the mortgage rates so far in 2023, peaking above 7% in late February and late May. Otherwise, they have remained between 6% and 7%.


Although mortgage rates have broken above 7% eight times so far this year—the first time because of the banking crisis, and the second because of the looming debt ceiling—I expect them to become a little less frantic as we move through the second half of the year. That said, my call for them to drop below 6% this year is now likely to be inaccurate given where they are today. I still expect them to drop into the “fives” though, but not until early next year.

Is housing inventory increasing?

A line graph showing the inventory of homes for sale in the U.S. from January 2020 to March 2023. In million, the number has gradually decreased from just above 1.5 to just above 1.0, bottoming out between January and March 2022 at below 1.0.


Listing activity saw a very modest late spring bump, but for perspective, the number of homes for sale is running at about 40% of its long-term average, and I still don’t see much growth this year. Why? Well, by my calculations, there could be over 20 million homeowners with mortgage rates around 3%. Why would they move!

Is 2023 a buyer’s or seller’s market?

A line graph showing the months of inventory for homes between 2017 and 2023, and whether that value corresponds to a seller's market, a balanced market, or a buyer's market. Most of the data points are in the seller's market range for these years, and Matthew Gardner predicts it is unlikely that we'll see a buyer's market in 2023.


And with limited inventory, the market still “technically” favors home sellers. Now, this is a little speculative because what defines a traditional “buyer’s” or “seller’s” market varies by location, but with relatively few homes on the market and the share of homes with price reductions dropping and list prices rising again, I just can’t see a buyer’s market appearing this year.

Are home prices falling?

A line graph showing U.S. median list prices for homes between January 2022 and April 2023. Prices were roughly $330,000 in January 2022, climbing to almost $400,000 during summer 2022, bottoming out at below $370,000 around January 2023, and returning to $390,000 by April 2023.


Well, this doesn’t look to be meeting my forecasts, does it! Sellers have been pretty bullish so far this year, but I would add that this is not true across the whole country. List prices are still down significantly in markets such as Hailey, Idaho; Jasper, Alabama; and Elko, Nevada, where list prices for single-family homes are down between 30 and 50% from their peak. So, I admit that the country has outperformed my forecast for list prices.

Return to Office Statistics 2023

A graph and table showing the number of U.S. employees subject to newly effective return-to-office mandates. May 2023 has the highest value at nearly 600,000 employees. Matthew Gardner predicts more employees will get clarity on these policies in 2023.


As I had expected, the pace of workers heading back to the office has not been very robust. In fact, the share of people in the office full time dropped to 42% in the second quarter of 2023, down from 49% in the first quarter, that according to The Flex Report. Meanwhile, the share of offices with hybrid work arrangements hit 30% in the quarter, up from 20% the previous quarter. But I still expect to see more workers heading back to their offices, albeit very reluctantly.

New Home Permits and Starts Have Fallen 

A line graph showing the number (in thousands) of U.S. single-family new home starts from January 2021 to March 2023. The numbers have almost entirely stayed in the 800-1,200 range, peaking above 1,200 in March 2021 and certain points between November and March 2022. In March 2023, the number of starts sat at just above 800,000.


With new home permits down 21% year-over-year, and new home starts off by 28%, I think its accurate to say that activity in the new construction sector has slowed. Builders continue to be hit by high financing rates as well as high material prices.

Are U.S. home prices dropping?

A map graphic showing 2023 U.S. home sale prices relative to their 2022 highs for select cities. Johnstown, PA has the greatest difference at -39.1% and Duluth has the least at -19.6%. Overall, Matthew predicts that the markets where home prices rose the fastest in recent years will experience a downturn.


As we all know, not all markets are created equal, and this chart shows how far below their 2022 highs some of the country’s metro areas are. On the opposite end of the spectrum, there are some markets where prices have already exceeded the highs seen last year (see map below).


A map graphic showing 2023 U.S. home sale prices relative to their 2022 highs, specifically some markets where prices have already exceeded the highs seen last year: Pueblo, El Paso, Hilo, and others.


Housing Affordability 2023

A line graph showing a homeownership affordability index from January 2020 to March 2023. The affordability line sits at 100. From January 2020 to May 2021, the trend line was above 100. It consistently dipped after that until January 2023, sitting just below 80.


Affordability has not improved, mainly due to home prices that remain out of sync with incomes as well as financing costs that remain well above the level that buyers had become used to. I still believe that this will not improve in 2023.


A power point slide showing recent changes in support of zoning changes including House Bill 1110, The New York Housing Compact, Florida SB-88, and the Make Virginia Home Plan.


And finally, I told you that governments would start to move to address the significant housing shortage that the country is experiencing, and they have. As you can see, in Washington State, Governor Inslee recently signed House Bill 1110 into law which allows the development of duplex up to six-unit buildings within any area zoned for single-family-only development. Additionally, jurisdictions in a significant number of states are either pursuing legislation to tackle this problem or have at least created task forces to look at the issue. It’s a good start, but more needs to be done.

Although it’s really cheating to grade one’s own work, I think that I have been pretty accurate with my forecasts. Yes, I was too pessimistic when it came to list prices and a little optimistic regarding the direction of mortgage rates. But other than those two items, the data seems to suggest that the housing market is headed in the direction that I had suggested.

What do you think? I’d love to hear your thoughts on this subject so leave your comments below. As always, stay safe out there and I’ll see you all next month. Bye now.

To see the latest real estate market data for your area, visit our quarterly Market Updates page.


About Matthew Gardner

As Chief Economist for Windermere Real Estate, Matthew Gardner is responsible for analyzing and interpreting economic data and its impact on the real estate market on both a local and national level. Matthew has over 30 years of professional experience both in the U.S. and U.K.

In addition to his day-to-day responsibilities, Matthew sits on the Washington State Governors Council of Economic Advisors; chairs the Board of Trustees at the Washington Center for Real Estate Research at the University of Washington; and is an Advisory Board Member at the Runstad Center for Real Estate Studies at the University of Washington where he also lectures in real estate economics.

W Report June 22, 2023

W Report – June 2023

Local market update.

High interest rates and scant inventory across King County are creating new dynamics for buyers and sellers alike. Both sides should be prepared to negotiate — buyers with more cash and sellers with accurate list prices.Find our full market recap here.

Local Market Update June 2023

News + trends.

Four tiny homes on wheels line a road in a park

[THE STATE OF] REAL ESTATE

Seattle approves new cluster of tiny homes

A new community of tiny homes in Magnuson Park will feature upgraded designs. These residences come equipped with plumbing and kitchens, making them excellent choices for long-term affordable housing.READ MORE

Gridlocked cars drive into Seattle on I-5 South

LOCAL ECONOMY

The return to office is making area commutes longer

You’re not imagining it. More employees in the office means more cars on the road, and longer drive times.

READ MORE

A row of small homes on a residential street.

[THE STATE OF] REAL ESTATE

Shoreline votes to legalize cottage housing

The new “middle housing” model aims to increase access to reasonably priced homes in the area.

READ MORE

The exterior of a local Fred Hutch office building.

LOCAL ECONOMY

Healthcare is now Washington’s top employment sector

The tech industry has been unseated by healthcare as the state’s top employer based on job postings.

READ MORE

Happenings.

Pin-spiration.

Row, row, row your…house? That’s right. These Floating Homes and houseboats will have you dreaming merrily all day long.

Floating Homes Pinterest Board

Cast your vote.

OPEN CONCEPT OR DINING ROOM
Which do you prefer? Click below to vote.
Cast your vote

OPEN CONCEPT! Flowing layouts are my favorite.

DINING ROOM! I prefer clearly defined spaces.

VOTE NOW

Last month’s poll results. Nature views: 87%. City views: 13%.

When you’re ready to talk real estate.

Buying June 12, 2023

How to Pay for a House

Buying a home is, for many people, the largest financial undertaking of their lives. So, how do the numbers work? How is the price of a property converted into a transaction? Let’s take a look at how to pay for a house by focusing on some of the major components in a real estate purchase, namely the down payment, earnest money, and the mortgage payments required to successfully buy a home.

How to Pay for a House

If you have enough money available, it is possible to make an all-cash offer on a house. Most home buyers, however, save enough money to make a down payment that works for them and finance the remainder of a home purchase with a mortgage. Saving money to buy a house requires significant planning, but by being proactive, you’ll eventually put yourself in a position of higher buying power. Reducing debt, increasing savings contributions, and finding additional streams of income are all helpful ways of generating some extra cash to pay for a house.

Making a Down Payment on a Home

The down payment is a lump sum paid upfront by the buyer. The actual down payment amount varies by transaction, but it’s usually somewhere between 3% and 20% of the home’s purchase price. It’s one of the most important home buying costs, given how much planning goes into it. There’s a snowball effect with the down payment; once you figure out how much of a down payment you can afford, that will determine your home loan’s principal amount. The higher the down payment, the less risk for the mortgage lender. When buyers aren’t able to make a down payment of 20% of the purchase price, lenders will require they purchase additional mortgage insurance to protect the investment.


A closeup of two men’s hands doing paperwork at an office desk as they figure out how to pay for a house. One man points to a calculator while the other takes notes.

Image Source: Getty Images – Image Credit: Perawit Boonchu


Earnest Money and Escrow

A real estate transaction is not your typical purchase. With so much money being moved around, it requires a little extra protection. This is where escrow comes in. Escrow ensures that your earnest money or “good faith deposit” gets properly disbursed according to plan during the home buying process, and holds property tax and homeowners insurance funds during the life of your home loan.

Making Mortgage Payments

Searching for a home loan is similar to searching for a home: there are many options, but based on what’s affordable and what works for your situation, you’ll eventually find the right one. When looking at the different types of home loans, you’ll compare the loans’ terms, interest rates, and conditions for repayment. For example, 15-year and 30-year mortgages are two of the most common home loan products. You’ll have lower monthly payments with a 30-year loan, but you’ll pay more interest over the life of the loan. With a 15-year mortgage, you’ll have higher monthly payments but pay less in total interest. Work with your mortgage broker to find the best home loan for you.