Facebook
 X
X
 Pinterest
 Copy Link
SOURCE: Windermere
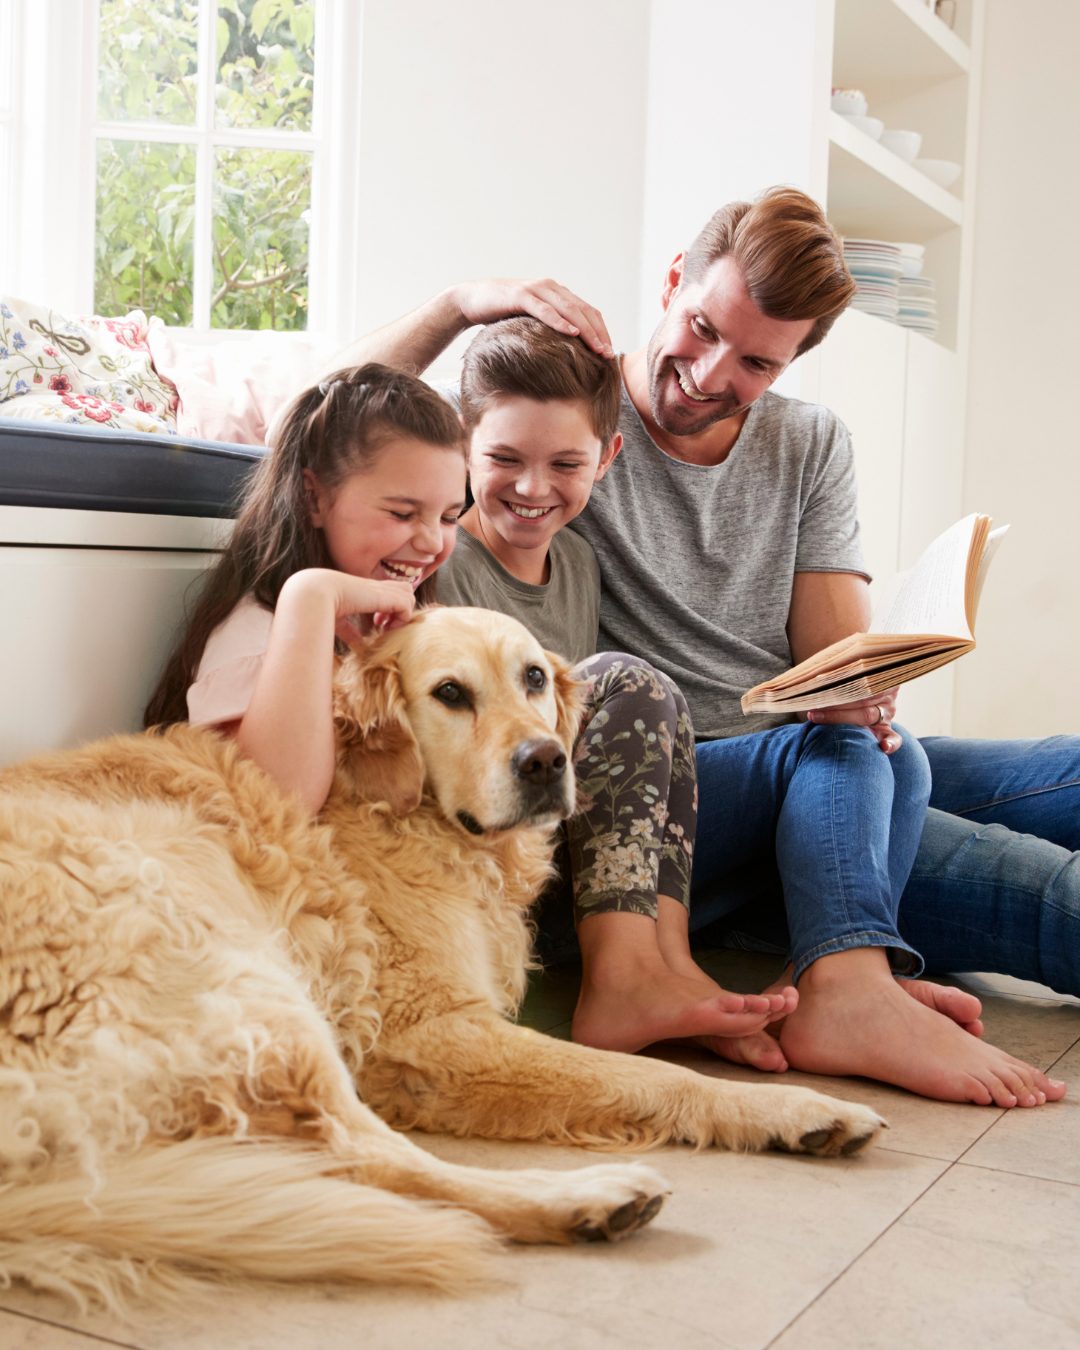
For pet owners, it’s hard to imagine their home without a furry friend. However, when it comes time to sell, showcasing the qualities of a home should take precedence over the pets that live in it. This creates additional steps in the process of preparing your home for sale, but it makes all the difference in the minds of buyers.
Selling a Home with Pets
Staging Your Home
A well-staged home makes it appealing to the widest variety of buyers and has significant ROI potential when it hits the market. However, having a pet can complicate the staging process. Buyers may lose interest in the home if they see traces of pets, so it’s a good idea to hide any signs of their presence.
It’s especially important to hide evidence of your pet in marketing photos. Prepare for your home’s listing photos by cleaning and vacuuming, making sure all pet stains are gone and any pet-related damage is repaired. Stow any pet carriers, cages, toys, food bowls, and other supplies that may hinder the photographer’s ability to capture the essence of a room.
Showing Your Home
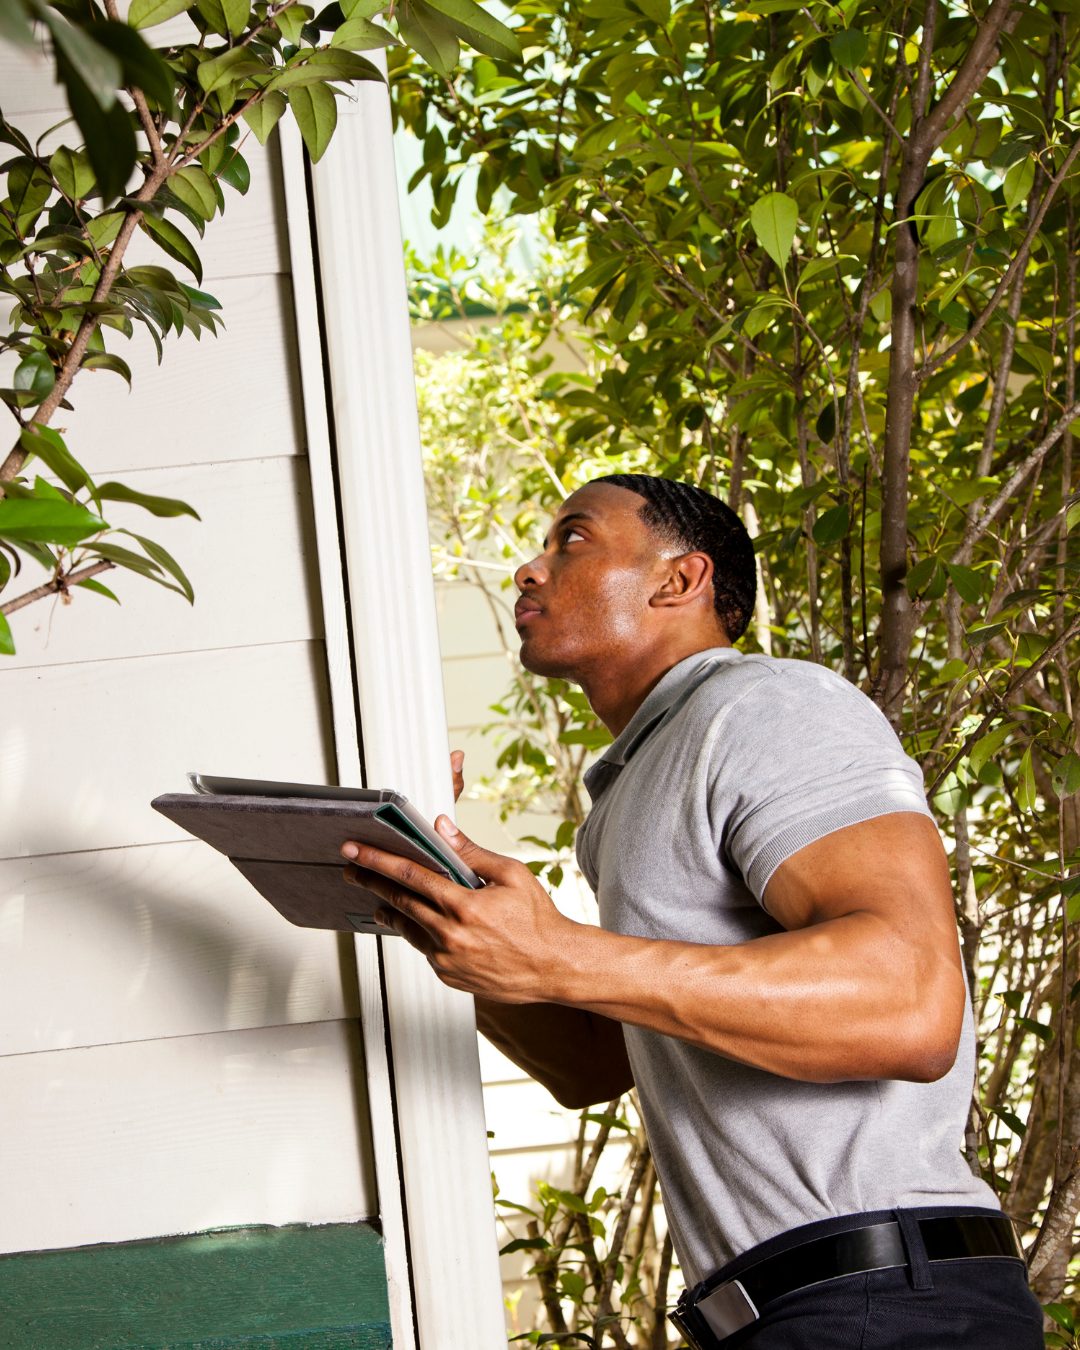
Before inviting potential buyers inside, it’s best to give your home a deep clean to improve your home’s air quality and to rid your carpets, flooring, and surfaces of pet odors and any dirt they may have tracked in over time. Provided you’re using your own furniture, vacuum and clean everything to extract as much fur and pet dander as possible. Talk to your agent to see if it’s a better idea to stage your home with rented furniture. If your pets have caused any damage in the home, make repairs or replacements as needed. After tending to your home’s interior, don’t forget to clean up after your pets in your yard as well. Fill in any holes in the lawn, freshen up your flower beds, and tidy up any areas of the landscaping where your pets may have dug.
After you’ve prepared your home for showings, there’s the question of what to do with your pets once buyers start taking tours. Ask a family member, friend, pet sitter, or neighbor to watch your pets while the showings take place. If you’re not able to find someone to watch them, form a strategy to temporarily relocate your pets during showings. If they must stay in the home, garage, or backyard during tours, it’s best to give buyers advanced notice that there are pets on the property. Talk to your agent about posting signage communicating their presence so that there are no surprises as guests make their way through the house.
Taking all these precautions will help to present your home in the best light without deterring certain buyers, for whom the signs of a pet may cause them to lose interest. On the other hand, if any buyers inquire about how the home can accommodate their pet, you and your agent will be more than ready to answer any questions they may have.
SOURCE: Windermere