
 Facebook
 X
X
 Pinterest
 Copy Link
|


|

|
|

This video is the latest in our Monday with Matthew series with Windermere Chief Economist Matthew Gardner. Each month, he analyzes the most up-to-date U.S. housing data to keep you well-informed about what’s going on in the real estate market.
Hello there! I’m Windermere Real Estate’s Chief Economist, Matthew Gardner, and welcome to the latest episode of Mondays with Matthew.
Before I get started, I wanted to let you know that this will be the final episode of Monday with Matthew for 2021 as I’m going to be taking Christmas off. So it’s time to offer you my forecasts for the U.S. economy and the country’s housing market in 2022.
Although many people – including myself – had hoped that COVID-19 would have become a somewhat distant memory by now, and that the economy would have recovered this was – sadly – not to be the case, and the pandemic’s influence on the economy is still being felt and all the datasets I track tell me that, although we are certainly healing, COVID continues to act as a drag on economic growth and I expect that to continue through the spring of next year – if not a little longer.
And it’s because of this that I – along with many other economists – have spent the last few months lowering our forecasts for economic growth – at least through the middle of 2022. So, let’s look at this a little closer.
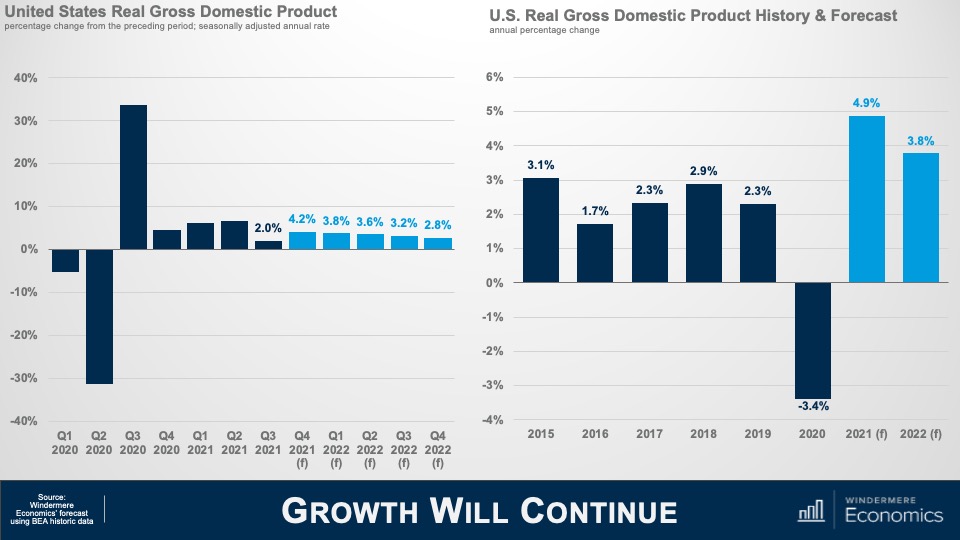
Here is my forecast for economic growth through the end of next year and you will note that, even though I am cautious in regard to the economy as we move through the winter and into 2022, I am still expecting to see a fairly decent bounce back in the fourth quarter of this year following the very disappointing rate that we saw in Q-3.
And on an annualized basis, I believe that the economy will have expanded by just shy of 5% this year and come in a little below 4% in 2022.
Simply put, the impacts of COVID-19 are going to continue to act as a drag on virus sensitive consumer services next year and ongoing supply chain issues will also delay inventory restocking. Both of these impacts have a depressing effect, in more ways than one, on economic growth, but I don’t see any chance that we will fall back into a recession.
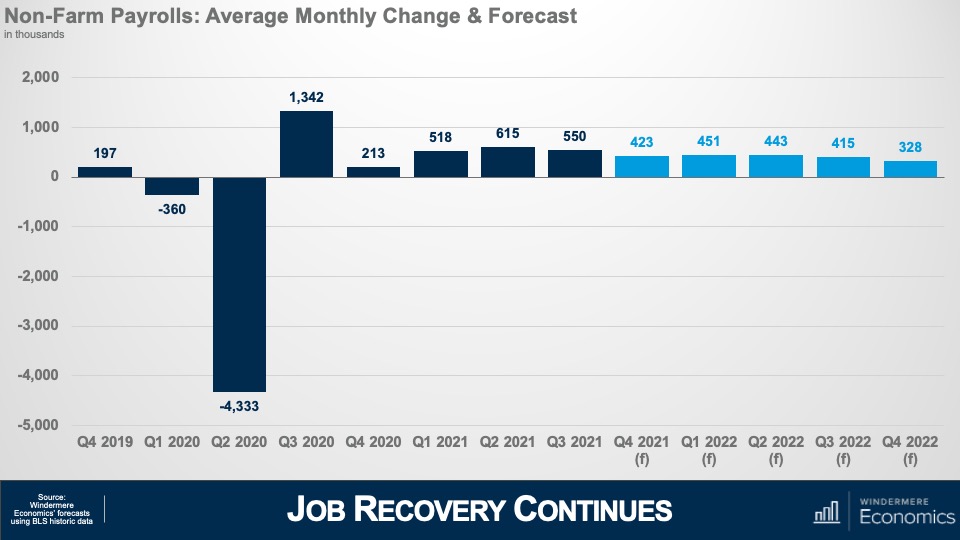
Looking at the employment picture this chart shows my forecast for average monthly growth in jobs during a quarter and to give you some context, over the last decade or so the country has added an average of around 200,000 jobs per month during any one quarter and my forecast is for more robust employment growth as we move through 2022 and, if correct, I expect to see the country return to pre-COVID employment levels in the second half of the year.
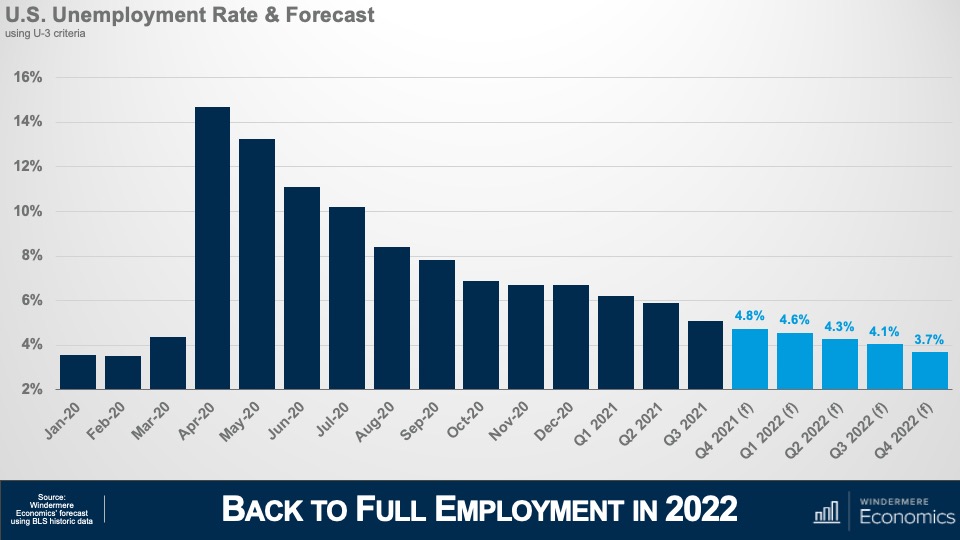
And with jobs continuing to return I’m looking for the unemployment rate to continue trending lower and breaking south of 4% during the final quarter of the year. With the expiration of enhanced unemployment benefits – in concert with wages rising significantly in many face-to-face industries such as leisure and hospitality – prospects for people currently unemployed are looking rather good. That said, there are still millions of unemployed Americans who are not looking for work even with wages rising, the labor force still down by 3 million from its pre-pandemic peak, and this is worrying as businesses continue to have a hard time finding employees which raises the expectation that inflation will remain higher for longer than I would have liked to see.
And that leads nicely into my final economic forecast and that is my outlook for inflation. As we have discussed, supply chain issues and labor shortages have increased prices significantly and this top chart shows annual changes in all consumer prices which I expect to remain around 5% until next spring, before gradually dropping down to below 3% by the end of the year.
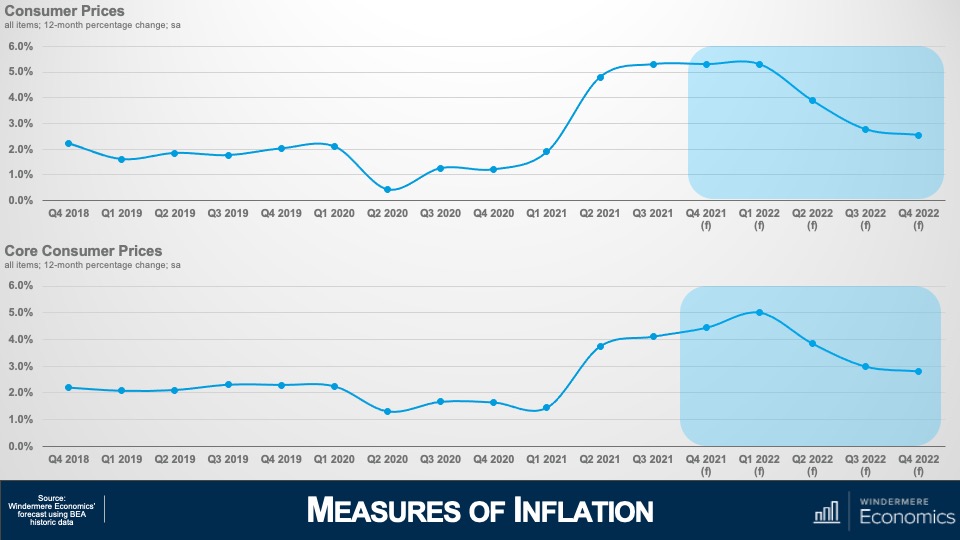
But the core inflation rate – which excludes the volatile food and energy sectors – won’t peak until early next year before it too starts to gradually pull back and, at these levels, the Federal Reserve will undoubtedly have started to raise interest rates to counteract inflationary pressures. This is not pretty, but I absolutely do not believe that we are in some sort of inflationary spiral, or that “stagflation” will raise its ugly head again.
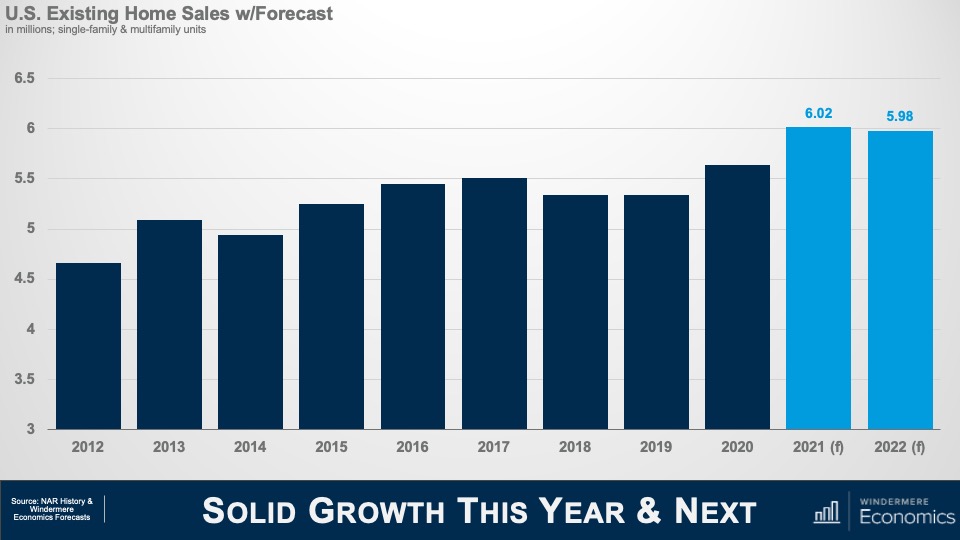
Okay! Now it’s time to turn our attention to the U.S. housing market which was a beacon of hope during the pandemic period and, given the massive spike in demand that started last June, I’m looking for a little more than 6 million existing homes will have changed hands in 2021, but I don’t see this level increasing in 2022 – mainly due to ongoing supply limitations as well as rising affordability issues, and I’m therefore forecasting sales to pull back – albeit very modestly – next year. That said, the country has never seen more than 6 million home selling in a single year since records were first kept so the number is still very impressive.
And with the market as tight as it has been so far this year, it shouldn’t be any surprise to see median sale prices skyrocketing and, even though we have 3 more months of sales data yet to be released, I still anticipate prices will have risen by almost 16 and a half % in 2021- a quite remarkable number. This pace of appreciation has never been seen before. In fact, the closest was back in 2005 – when the housing bubble was inflating rapidly – but even then, prices only rose by 12.2%.
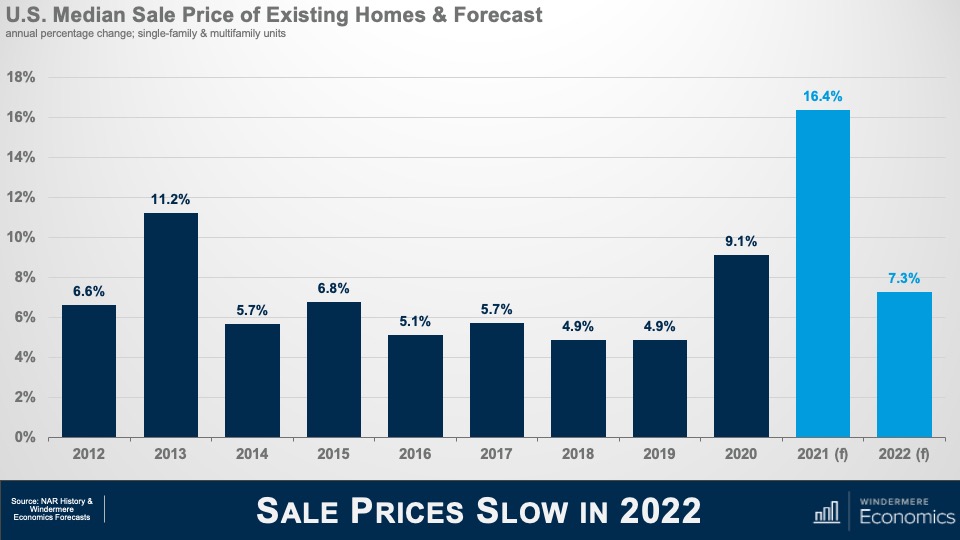
But, as I mentioned in my sales forecast, this pace of growth is unsustainable and I am expecting to see some of the heat to come off the market next year but, a growth rate of 7.3% is certainly nothing to sniff at.
There are three major reasons why we will see the pace of growth slow. I have already mentioned my concerns regarding housing affordability, but mortgage rates and new supply will both influence the slowdown in sales and price growth in the resale arena.
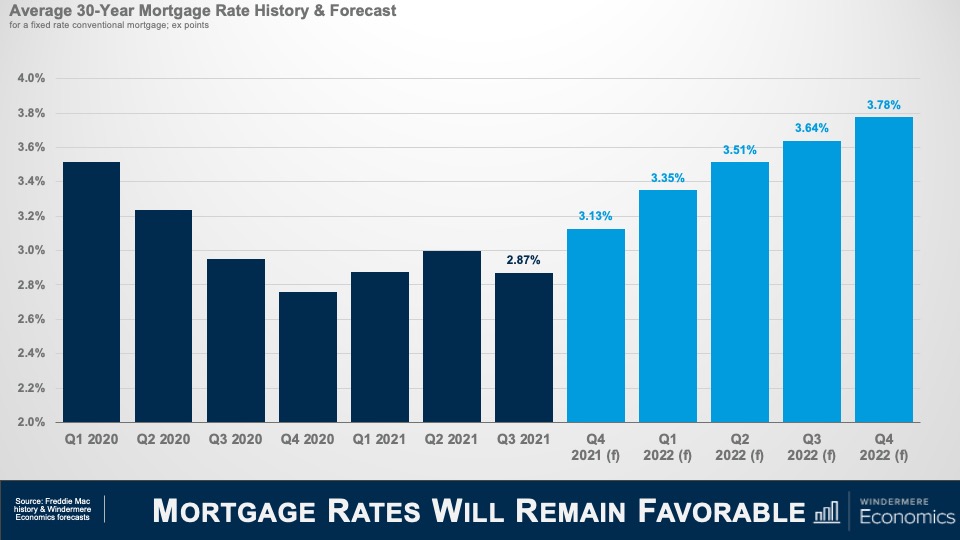
Although I do not prepare a forecast for housing affordability, this is my where I expect to see mortgage rates through the end of next year and I am looking for them to continue “stair-stepping” higher but still ending 2022 below 4% – very low by historic standards given that the long-term average for a conventional 30-year mortgage is somewhere around 7 1/2%.
Obviously, as rates notch higher that starts to compress price growth as it puts a lower ceiling on how much a buyer can afford to pay for a home.
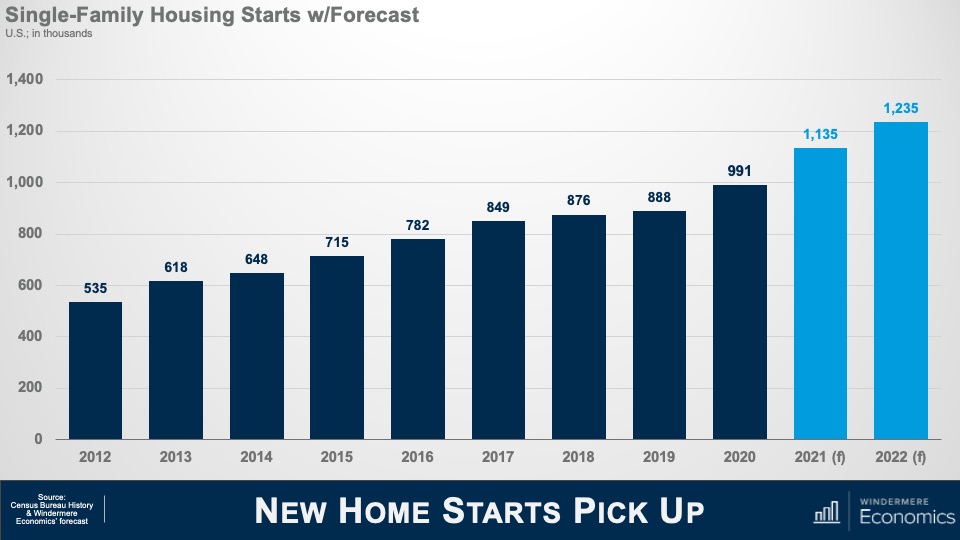
And slowing growth in existing home prices and sales will also be a function of additional supply and this chart shows my forecast for single-family starts this year and next. I expect more than a million homes to start construction in 2022 – continuing the trend that started in mid-2020 – but I am sure that some of you may be asking yourselves that if starts are already robust, how have existing home sales been able to increase so significantly if there has been solid supply coming from homebuilders – and that would be a great question.
And I would answer this by telling you that the way the Census gathers data on start is to count the number of home foundations that have been poured, but vertical construction has not necessarily started. And what we have been seeing is a lot of foundations but not so many homes actually being built – and we know this by looking at the number of homes that are for sale but have yet to be started. So, it’s important to look at a separate number that the Census Bureau also puts out which counts the number of units actually under construction, and that number has been growing significantly over the course of the last 18 months or so.
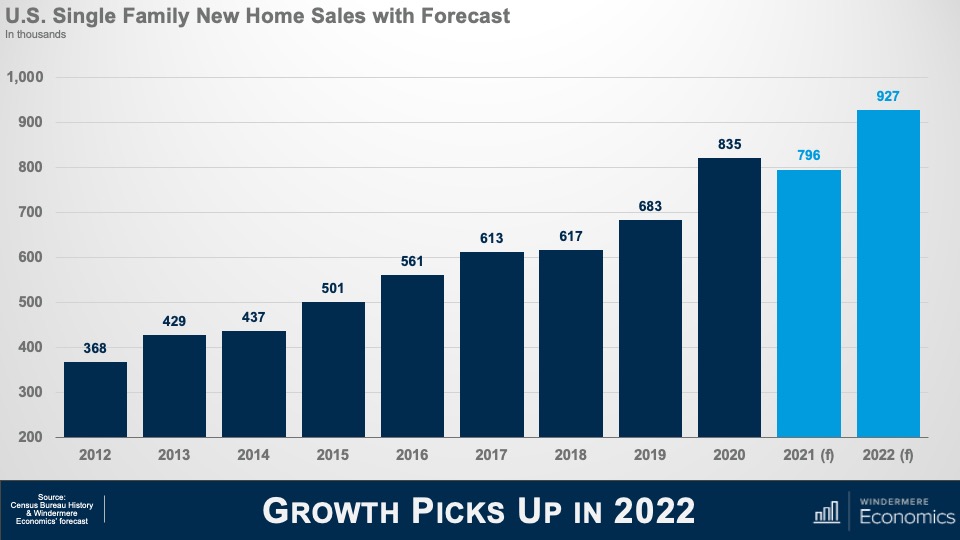
Builders have been hamstrung with rising labor and material costs which will lead new home sales this year to fall below the number seen in 2020; however, I do expect this to pick up significantly next year and my current forecast calls for 927,000 new homes to be sold in 2022.
So, there you have it, my economic and housing market forecast for 2022.
Of course, there are still a number of variables that could lead me to revise this forecast but, as an old economics professor of mine used to tell me, “Gardner, forecast well, but forecast often!”
If everything goes according to my plan, you should expect to see the housing market start to move towards some sort of balance next year, but I am afraid that it will still remain out of equilibrium until at least 2023.
And if you’re wondering, no, I don’t see a housing bubble forming and I’m also not at all concerned about homeowners currently in forbearance, but it would be silly to say that there aren’t any issues in the housing market that concern me because there are and the biggest of which is housing affordability and this will have a significant impact on the millennial generation who are continuing to get older, and they are all – well most – thinking about settling down and, possibly, having children, and I wonder how hard it will be for many of them to be able to afford to buy their first home because most really do want to become homeowners. Will builders figure out how to build to this massive pent-up demand? I guarantee you that whoever can solve this puzzle will do very, very well.
COVID-19 caused an unparalleled shock to the US economy and the rise of the delta variant has certainly impacted the speed of our recovery but, rest assured, this particular forecaster firmly believes that we will recover and that the economy will continue to grow.
Demand for ownership housing remains remarkably buoyant and, in fact, it is quite likely that demand may actually increase with the work from home paradigm that will start to gain momentum next year. It will be fascinating to watch how this impacts not just demand, but where these buyers will ultimately choose to live.


Deciding when to sell your home can depend on a variety of factors. Perhaps your local market conditions are favorable to sellers, or you’ve recently changed jobs, or your family is growing and you need to upsize. Whatever the case may be, making the decision to sell your home is the first step in your selling journey.
Once you know it’s time to sell your home, it’s natural to feel a wave of emotions. A home is an integral part of a homeowner’s life. They provide countless memories and, for many homeowners, are their greatest investment. But once you’ve decided to sell, it’s important to look at your home with an objective eye to appeal to a wide variety of buyers.
To get your house in top selling shape, identify its outstanding repairs. As you fill out your list, separate the projects into categories which are DIY-eligible, and which require a professional. This will help you to budget for your overall repair expenses and build a reasonable timeline. Some of the most important repairs to make before listing your home include fixing appliances, making sure your sinks and faucets work properly, repairing any cracks or holes in the walls, fixing all leaks and water damage, and ensuring that all systems in the home are functioning properly. Making repairs before you list your home will bode well for home inspections, negotiations, and can even give your home an advantage over other listings. Your agent may suggest a pre-listing inspection to make your home more competitive in a seller’s market.
When you sell your home, you’re inevitably competing against other listings in your area. The aesthetics of a house play a significant role in its ability to catch buyer’s attention, which emphasizes the importance of improving your curb appeal as you prepare to hit the market. Landscaping projects, new exterior paint, and upgrading your front entry are just a few ways you can spruce up the outside of your home.
And what about the interior? Consider upgrading your appliances to energy-efficient models, which are known for their high ROI potential. This is a great time to repaint your home’s interior as well. Consider using a neutral color palette to make it as appealing as possible to a wide-array of buyers. It’s also a good idea to identify rooms in which the flooring should be replaced or repaired. If it makes most sense to completely re-do your home’s flooring, choose a material that is within budget and has good resale value.
Listing agents are trained professionals who work with homeowners to sell their homes. Your listing agent will be there to answer any questions you may have throughout the selling process and will negotiate with buyers’ agents to get the best price for your home. But their value doesn’t stop there. A listing agent will list the home, coordinate showings and open houses, and market the home. When choosing an agent, find someone with whom you are compatible both emotionally and professionally, and who cares about the goals of you and your household.
Homeowners can get a general idea of how much their home is worth by using online home value estimators, like Windermere’s free Home Worth Calculator. Though these tools can provide some context behind the value of your home, nothing compares to the in-depth analysis of an agent’s Comparative Market Analysis (CMA). Using a CMA, an agent can accurately price your home to get it sold quickly.
For more information on your local housing market and how to sell your home, give me a call.


The following analysis of the Western Washington real estate market is provided by Windermere Real Estate Chief Economist Matthew Gardner. We hope that this information may assist you with making better-informed real estate decisions. For further information about the housing market in your area, please don’t hesitate to contact your Windermere Real Estate agent.
The emergence of the of COVID-19 Delta variant had a palpable impact on the region’s economy, which, naturally, impacted the job recovery. Employment levels in Western Washington had been picking up steam in the spring but started to slow quite dramatically over the summer. To date, the region has recovered more than 201,000 of the jobs that were lost due to the pandemic, but we appear to be in a bit of a holding pattern. That said, the ending of enhanced unemployment benefits has led many business owners to see more applicants for open positions, so I am hopeful the numbers will pick back up as we move into the winter months. The most recent data (August) shows the region’s unemployment rate at a respectable 5%, but we still have a way to go before we reach the pre-pandemic low of 3.7%. On a county level, the lowest unemployment rate was in Kitsap County (4.4%) and the highest was in Grays Harbor County (6.6%). There are still many hurdles in front of us, but I believe we will continue to add jobs and reach full employment recovery by mid-2022.
❱ Sales in the third quarter rose 6.4% year over year, with a total of 27,280 homes sold. The increase matched what we saw in the second quarter of this year.
❱ I was pleased to see sales growth continue. This rise was supported by a 28.4% increase in the number of homes for sale. Listings rose the most in Grays Harbor (+62.6%), Lewis (+53.6%), and Skagit (+52.0%) counties.
❱ Sales activity was mixed. Nine counties saw year-over-year growth, but sales slowed in six counties. That said, sales were up in every county other than King and San Juan compared to the second quarter of 2021.
❱ The ratio of pending sales (demand) to active listings (supply) showed pending sales outpacing listings by a factor of 4.6. Even with the increase in the number of new listings, the market is far from balanced.

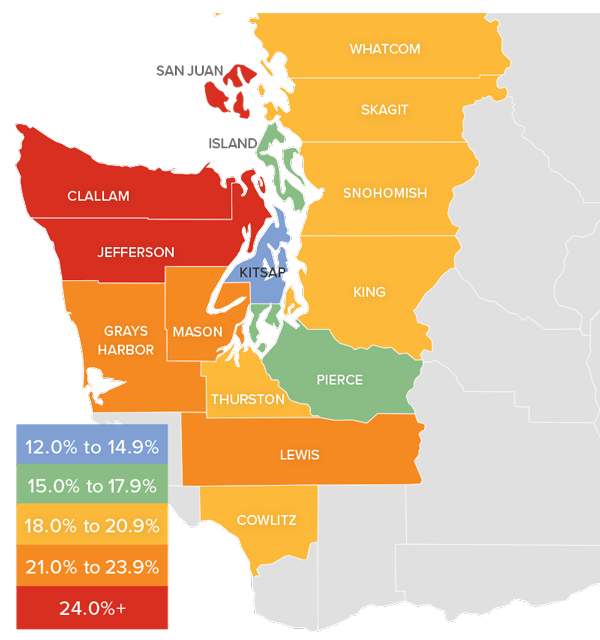
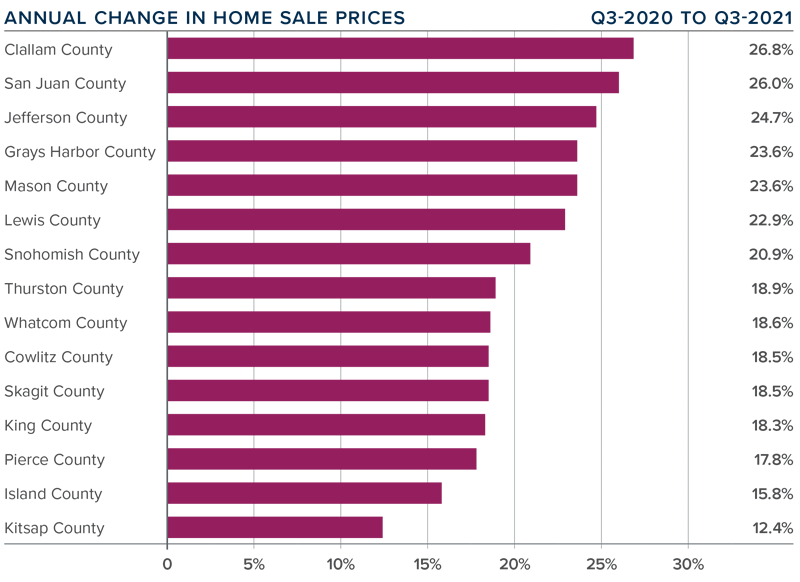
❱ Home prices rose 18.9% compared to a year ago, with an average sale price of $726,168—another all-time record.
❱ When compared to the same period a year ago, price growth was strongest in Clallam, San Juan, and Jefferson counties, but all markets saw prices rise more than 12% from a year ago.
❱ Average sale prices pulled back 1.1% compared to the second quarter of this year. Given the massive increase in value over the past few years, it is not at all surprising. The key indicator has been a softening in list prices and that naturally translates to slower price growth. This is nothing to be worried about. It simply suggests that the market may finally be heading back to some sort of balance.
❱ Relative to the second quarter of this year, all counties except San Juan (-0.1%), Island (-0.5%), and Whatcom (-0.5%) saw higher sale prices.
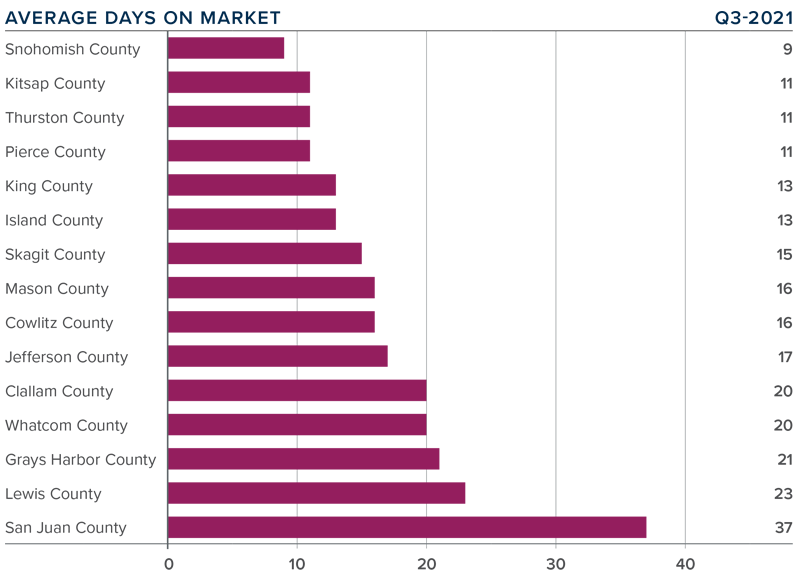
❱ It took an average of 17 days for a home to sell in the third quarter. This was 19 fewer days than in the same quarter of 2020, and 1 fewer day than in the second quarter of this year.
❱ Mirroring the second quarter, Snohomish, Kitsap, Thurston, and Pierce counties were the tightest markets in Western Washington, with homes taking an average of 9 days to sell in Snohomish County and 11 days in the other three counties. The greatest reduction in market time compared to a year ago was in San Juan County where it took 102 fewer days for homes to sell.
❱ All counties contained in this report saw the average time on market drop from the same period a year ago, but eight counties saw market time rise from the second quarter; however, the increases were minimal.
❱ Even with inventory levels increasing in most markets, the region’s housing market remains remarkably tight. That said, I do see some of the heat dissipating and I am hopeful that if inventory levels continue rising, we will start a slow move back toward a balanced market.
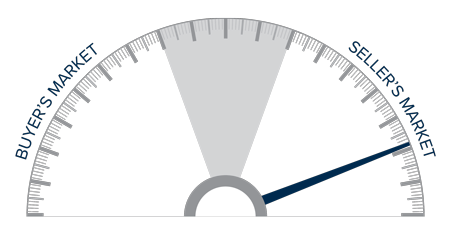
This speedometer reflects the state of the region’s real estate market using housing inventory, price gains, home sales, interest rates, and larger economic factors.
Even given the speedbump that hit the region’s economy with the emergence of the Delta variant, the housing market remains remarkably resilient. Demand from buyers continues to be very strong, and modestly increasing inventory levels appear to have—at least for the time being—reduced some of the fever from the market. Mortgage rates remain very favorable, and my current forecast is for them to stay in the low- to mid-3% range until next summer. Rising inventory levels have led price growth to slow and days on market to start increasing, which may be a sign that the market is retreating from a prolonged period of exuberance.
As we move through the balance of the year, I believe demand will remain solid, but we will continue to see price growth soften as more listings compete for the buyers that are out there. That is not to say price growth will turn negative; rather it suggests that we are slowly moving back toward a more balanced market. That said, the market certainly still favors home sellers. As such, I am leaving the needle in the same position as the second quarter. I may move it a little in the direction of buyers next quarter if the current trend continues through the winter months.

As Chief Economist for Windermere Real Estate, Matthew Gardner is responsible for analyzing and interpreting economic data and its impact on the real estate market on both a local and national level. Matthew has over 30 years of professional experience both in the U.S. and U.K.
In addition to his day-to-day responsibilities, Matthew sits on the Washington State Governors Council of Economic Advisors; chairs the Board of Trustees at the Washington Center for Real Estate Research at the University of Washington; and is an Advisory Board Member at the Runstad Center for Real Estate Studies at the University of Washington where he also lectures in real estate economics.

This video is the latest in our Monday with Matthew series with Windermere Chief Economist Matthew Gardner. Each month, he analyzes the most up-to-date U.S. housing data to keep you well-informed about what’s going on in the real estate market.
Hello there! I’m Windermere Real Estate’s Chief Economist, Matthew Gardner, and welcome to the latest episode of Mondays with Matthew.
A few weeks ago, one of my viewers on You Tube sent me a note asking when I was expecting mortgage rates to start to rise and, if I believed that they were going to go up, how fast will they rise, and what impacts will higher rates have on home prices.
Well, I would like to thank this particular viewer for the question, and it’s going to be the topic of today’s video.
But before we start looking at the future of mortgage rates, I was speaking to some of our interns here at the office a while ago and one of them asked me to explain how mortgage rates are set and – because this is somewhat pertinent to today’s topic – I thought that I’d take just a minute or two to explain to you how this all works.
Of course, there are a lot of factors that impact the rate that a home buyer themselves will get, and they include credit quality, loan-to-value ratios and the like, but the base rate is set not by looking at a home buyer, but at the economy itself and, specifically, the bond market – and even more specifically, the interest rate of 10-year US treasuries.
Now, if you’re asking yourself why 30-year mortgages are based off 10-year bonds and not 30-year? Well, that would be a good question, and this is the answer. You see we move, on average, every 10 years and that’s why!
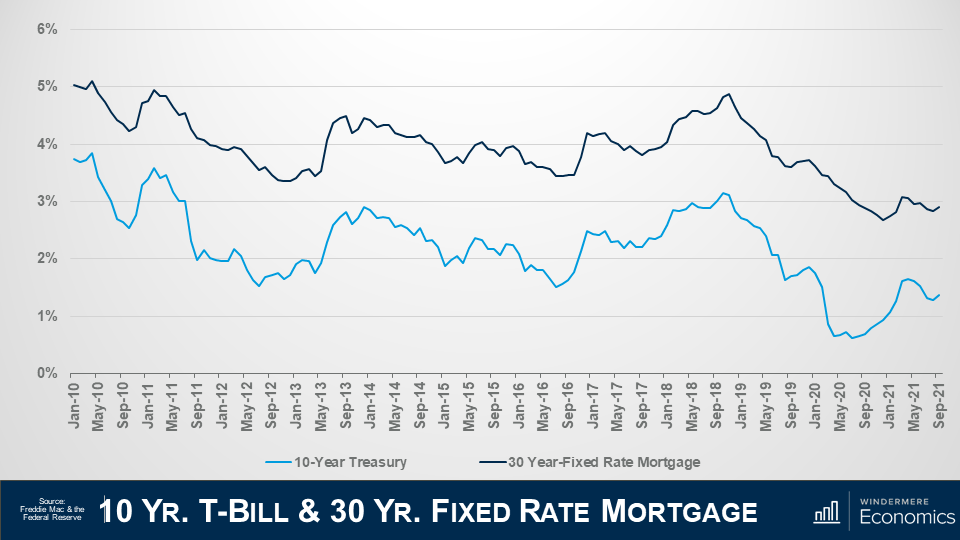
Here is a chart showing the average yield – or interest rate – on 10-year treasury bills by month going back to 2010 in light blue, and the average 30-year mortgage rate in dark blue. I hope that you can see the tight relationship they have to each other.
Of course, there are times when bond yields can go down and mortgage rates rise, and vice-versa but, in general, they track each other pretty closely.
And if you’re wondering why the rates aren’t simply the same, well it’s because a treasury bond has no risk – as its backed by the US government – but there is some risk associated with a mortgage, so buyers of mortgage bonds expect a premium to be added because of this risk, and this has averaged just over 1.5% since the 30-year mortgage came into being back in the early ‘70’s.
Now, there are some people out there who think that the interest rate on 10-year treasuries doesn’t set mortgage rates, rather its better to track the interest paid on mortgage bonds and, although I do see why they might think this, the base mortgage rate is actually set by treasury yields and the interest on mortgage bonds is set using that base and adjusting it to manage the prevailing risk tolerance that investors are prepared to accept so I believe that watching movements in the interest paid on 10-year treasuries is the right way to go.
And that, in essence, is how the 30-year mortgage rate is set.
If you are a regular viewer of these videos you will now that I like to start off with some context to the subject I am addressing and this chart will show the average rate for conforming 30-year fixed rate mortgages going back to their genesis in the early 1970’s.
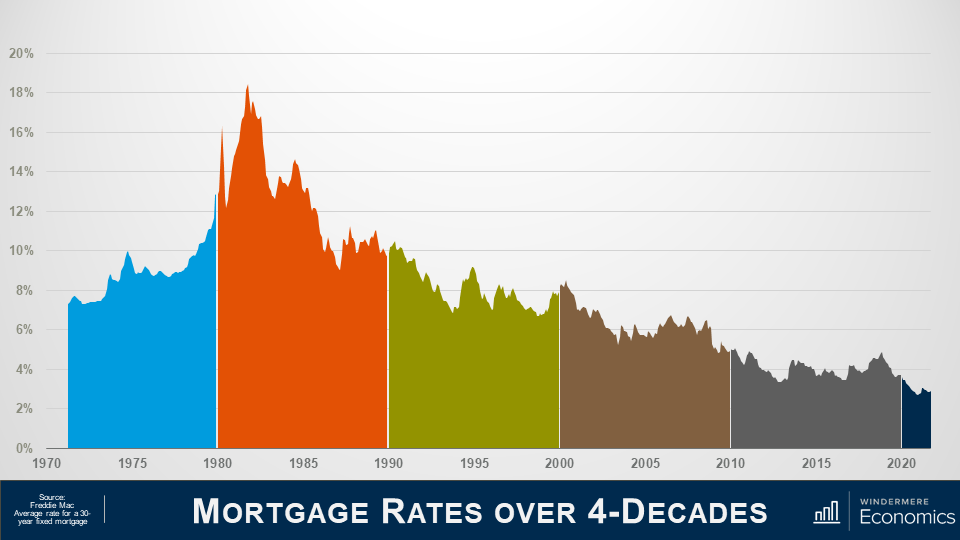
Back in ‘71 rates were in the mid-7% range, rising to just under 10% in ‘74, before pulling back but, as you can clearly see, they started to spiral upward in ’77, ending the decade at almost 13% and if you’re wondering what led to this massive jump, well this was because the country had entered a period of high inflation.
In the ‘70s the country was pushed into a recession basically due to an oil embargo that led to the price of oil quadrupling and that led to a period of so-called stagflation which is when inflation rises, and economic activity slows.
And in the early ‘80’s we entered a period of so-called hyperinflation, as another oil embargo was took hold and the Fed was forced to step in and raised short-term rates which led rates along the yield curve to rise and this – of course – included 10-year treasuries which hit 15.3% in the fall of 1981 and that, as we have discussed, caused mortgage rates to hit an all-time high in October of 1981 at close to 18.5%. Rates then started to pull back and
In the 90’s, rates started to trend lower but jumped again in ’94 as the Fed tightened monetary policy given the significant growth that the country was seeing, but they started to pull back in the second half of the decade, falling to the mid-6’s before notching higher in ’99.
In the 2000’s, rates dropped to 5.3% in 2003 as the housing market boomed but, as we all know, it wasn’t all unicorns & rainbows in this decade of what was then – historically low rates.
The housing crash led the Fed to jump in by cutting interest rates, but they also started a massive purchase of mortgage bonds at very low interest rates as they were happy to take a low return as long as it stabilized the housing market. As a result of their efforts, mortgage rates fell almost a full percentage point, averaging just a hair above 5 % in 2009.
Riding the wave of low bank borrowing costs, mortgage rates entered the new decade around 4.7% and continued to fall steadily, dropping to the mid-3’s by 2012. But in 2013 you can see that rates headed higher. Why? Well, a big part of this has to do with some panic in the bond market, but we will get to that shortly.
Anyway, rates went up in 2014 before dropping to 3.85% in 2015 as the market calmed down.
They rose again after the 2016 presidential election, reaching their peak at the end of 2018 and start of 2019, but still ending the decade below 4%.
As for the current decade, well, it’s all been about COVID-19.
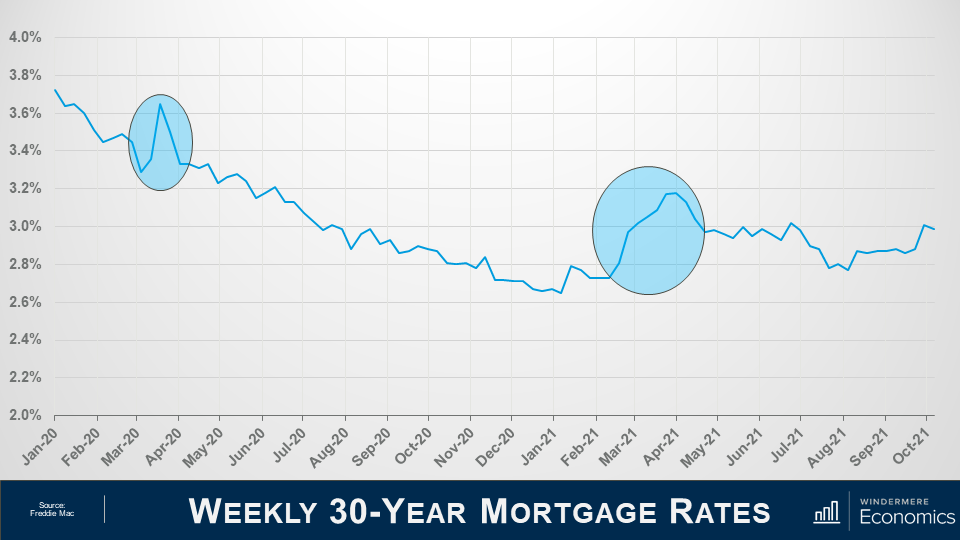
To understand what’s happened over the past couple of years, we need to look at the weekly average rate and I am sure that you have noticed the first spike in the graph.
And it was totally due to the Coronavirus which created an unprecedented situation for all rates (not just mortgages, but US Treasuries and everything else).
You see, investors were panicking during the early stages of the pandemic, not just because the country – essentially – shut down for a brief period, but there were rumors about a thing called forbearance, and investors were panicking that they would not get paid for the mortgage bonds they held, and they did what we all do when we get worried about the economy and, specifically, our investments. They get out of their investment positions and into cash and that’s absolutely what they did, but I should add that I am not talking about them stashing dollars under the mattress. No, they moved into cash positions in financial markets, which are the most liquid, nimble place an investor in the US can be.
And with a lot of institutions and individuals getting out of bonds and not many buyers out there, what happened to rates? That’s right, they rose to attract buyers and rise they did. So much so, in fact, that on a single day in March of 2020, mortgage bonds prices changed 5 times! Quite unprecedented.
Anyway, the Fed reverted to their old playbook and went on a massive bond buying spree with the biggest ever purchase of mortgage-backed securities on Thursday March 19 but, quite remarkably, they announced the very next day that they were going to buy even more. How much more, you ask… Well, they decided to buy three times more than the record purchase they made just the day before!
And because of this, rates dropped dramatically and continued to pretty much head lower for the rest of the year and into early 2021.
But then the music stopped, as you can see in the second highlighted spike in the above graph.
You see, a special election was being held in Georgia and the bond market decided to take a conservative stance prior to the election and that led rates higher again. But the election wasn’t the only reason why rates rose.
You see, COVID 19 cases that were dropping, improved vaccine distribution appeared to be in place, there were several stronger than expected economic reports released, and progress on a fiscal stimulus package. All of these factors led rates higher because, as you know, when economic news is positive, that is actually bad for bond yields as people move back into equities and out of bonds which is obviously bad for mortgage rates as bonds need to offer a higher interest rate to attract the few buyers that were out there.
So that’s where we are today, but what of the future?
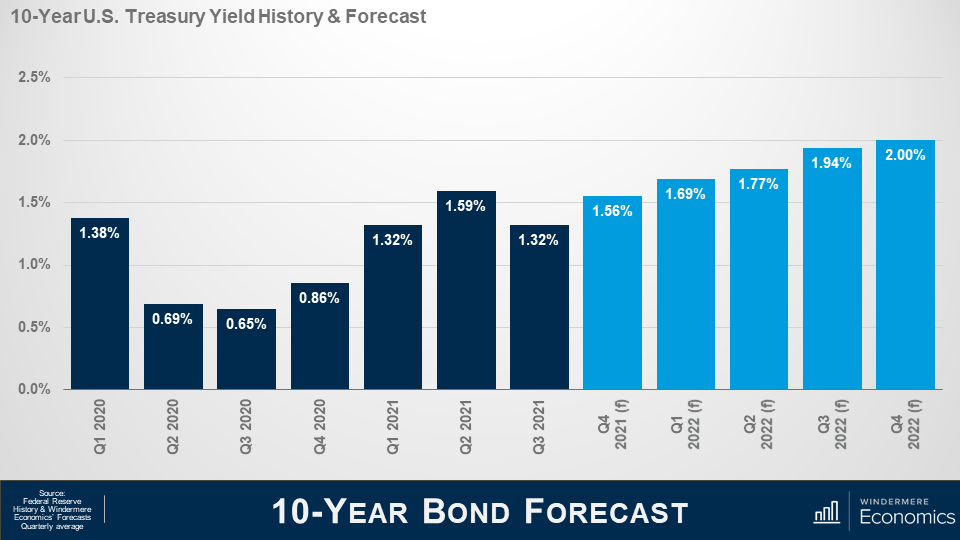
Here is my forecast for 10-Year treasuries through the end of next year and you will see that I am looking for rates to rise gradually as we move into next year and this will lead mortgage rates to start notching higher as well.
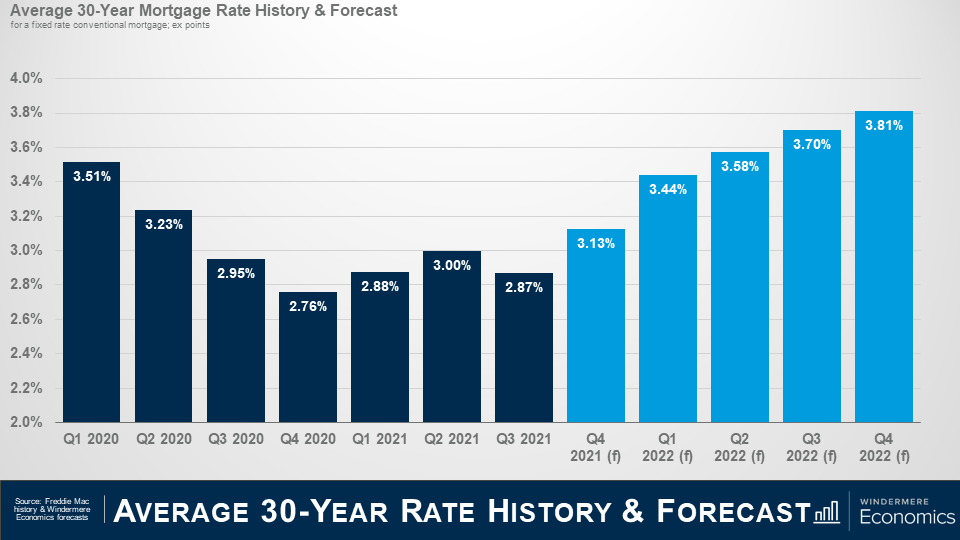
And here is my forecast for mortgage rates. Although they should move higher, I am still not seeing rates break above 4% until 2023 at the earliest and – even as they start to increase – I really don’t see it as a major deterrent to home buyers.
But before you start to say that this is only one person’s forecast and it could be wrong, lets look at my forecast compared to some of my industry colleagues.
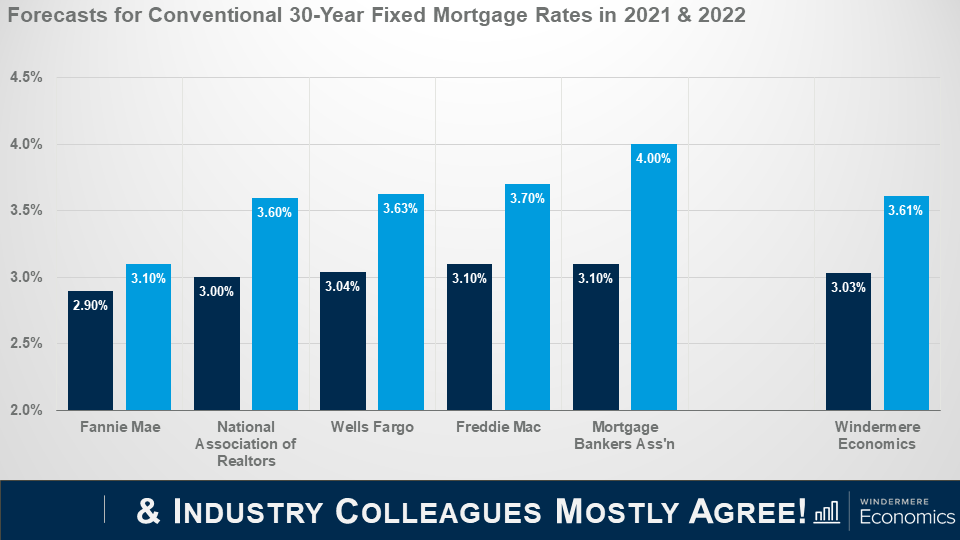
As you can see, we are all in a pretty tight range when it comes to forecasting the average rate this year and next.
The bottom line is that although rates will rise, they will remain very competitive when compared to historic averages and the upward trend in rates is unlikely to have any significant impact on prices. That said, many markets are already having an affordability crisis and rising rates will certainly act as an additional headwind to price growth; however, it would take a significantly greater increase in rates to negatively impact prices.
Well, I hope that you have found this month’s discussion to be interesting. As always if you have any questions or comments about this topic, please do reach out to me but, in the meantime, stay safe out there and I look forward the visiting with you all again, next month.


Windermere offices across the Western U.S. have remained committed to serving their communities in 2021, collectively raising nearly $1.5 million so far this year alone, pushing the foundation’s grand total raised since 1989 to nearly $45 million. After a successful Community Service Day in June and a first half of the year which saw over $1 million raised, Windermere offices have continued to give back this summer. Here are some recent highlights from across our network.
Windermere Utah has always been deeply rooted in its community, and 2021 has been no different. This year alone, they have hosted multiple fundraisers and supported several organizations to affect positive change in their community.
One of the greatest challenges the COVID-19 pandemic has put on schoolchildren is access to technology. After searching for a way to provide digital access to local schoolchildren, Windermere Utah came across the organization Spy Hop, based in Salt Lake City. Spy Hop is a digital media arts center that provides classes in film, music, audio, and design for students between the ages of nine and nineteen. They offer mentoring and host technology drives to provide computers for students in need through a program called the Technology Liberation Project. Windermere Utah donated $3,000 to support Spy Hop’s programs while sponsoring their technology drive in August.
The office also rallied together to support Lincoln Elementary School. As a Title I school, they cannot ask for supplies or funds, often leaving them underfunded compared to other schools in the area. Windermere Utah donated $1,000 for kids to purchase the supplies they need for the school year.

From Left to Right: Misty Medina, Laurann Turner, Lincoln Elementary Rep, Shawnee Cooper, Lincoln Elementary Rep, Michelle Adkins, Chelle Preslar, Kelly Silvestor, and Stephanie Vera
Windermere Evergreen has close ties to the local Rotary Wildfire Ready program and given the prevalence of wildfires across the Western U.S. in recent years, the office was inspired to tap their Foundation resources to support local wildfire relief efforts. John Putt–managing broker at Windermere Evergreen—is a member of the Rotary Wildfire Ready leadership council. A former paramedic and firefighter, he is passionate about providing resources and education to mountain communities regarding wildfire preparedness. After trying to come up with ways to support the program, they settled on a classic method of bringing the community together—a good old tailgate party. The office donated $1,000 to support the Rotary Wildfire Ready program, and the first annual Windermere Foundation Tailgate Party saw members of the community come together from all corners of town.

The Evergreen, Colorado Rotary Wildfire Ready firetruck.
After hosting a blood drive earlier this year, Windermere Spokane has continued to find ways they can provide for those in need in their community. In early September, they turned their attention toward Spokane’s youth. When they saw the Spokane branch of Volunteers of America announce that they were planning to move their Crosswalk Youth Shelter across town to a new facility, the office jumped at the opportunity to help. Windermere Spokane held a matching fundraiser that ultimately raised over $21,000 for the new shelter. But the office’s recent foundation efforts didn’t stop there.
In preparation for the new school year, the office held their Spokane Sock and Shoe Event to support local low-income and homeless grade school-aged kids with new pairs of shoes and socks. This year’s event provided new shoes and socks for 116 kids.

Left to Right: Windermere agents Blythe Thimsen and Brenda McKinley

Windermere agent Brenda McKinley
Windermere agents John Kritsonis and Karl Lindor of Kritsonis Lindor have been strong supporters of the Issaquah Food & Clothing Bank in years past, but the continued challenges of the COVID-19 pandemic made it clear that the IFCB needed their support more than ever. After food insecurity for children in their county jumped 54% in 2020, John and Karl knew they had to go all-in for their community. They doubled down on their fundraising campaign with a $25,000 match, ultimately raising $55,958. On August 20, their team spent the day volunteering at the food bank, putting together produce bags, and passing out groceries to families. All in all, they were able to provide groceries to over 120 families and over 350 kids. Their donations will support IFCB’s summer lunch program, which feeds roughly 300 children weekly during the summer.
To learn more about the Windermere Foundation, visit windermerefoundation.com.


Whether you’re a first-time homebuyer or have purchased a home before, the same mistakes can rear their head at any point in the buying process. By working closely with your agent, you can identify these pitfalls ahead of time and adjust accordingly. Mistakes in the buying process can lead to higher costs, added stress, and even terminated contracts. Here are ten common mistakes to avoid when buying a home.
Getting pre-approved is a key component of the early stages of the buying process and will help to maximize your chances of getting your offer accepted. Getting pre-approved will give you a concrete idea of how much you can borrow, how much house you can afford, the estimated monthly costs of your mortgage and its corresponding interest rates. It also communicates to sellers that you are a serious buyer.
Pursuing listings you can’t afford is a surefire way to start your home buying process off on the wrong foot. Buying a home that’s outside your budget will put added pressure on your finances and increases your chances of foreclosing, should your financial situation take a turn for the worse. Use the general rule that your house payment should never be more than 25-30% of your take-home pay, and as you prepare for talks with your lender be sure to account for all the expenses you will incur, including private mortgage insurance (PMI) if applicable.
Opening new lines of credit at any point in the home buying process will slow things down and can affect your chances of getting a home loan. Adding another credit card to your collection or taking out a loan will change your credit score, causing a ripple effect that can bring the buying process to a halt. Because new credit changes your debt-to-income ratio, lenders will likely want to review your mortgage approval and your risk of non-payment. This forces sellers to wait around for your application while competing buyers speed ahead of you in line.
It’s understood that a home is a valuable asset that needs to be protected, but it is still all too common for homeowners to be under-insured. A homeowner’s insurance policy covers your home, your belongings, living expenses and injury or damage to others that occur on the property in the event of a disaster. Work closely with your insurance broker to make sure you have adequate coverage for the most common risks in your area like flood, earthquake, and more.
With a little resourcefulness, you can tap into new sources of financial support that will help to ease the burden of making a home purchase. VA Loans can be a lifesaver for active service and veteran personnel, offering zero down payment and lower-than-average mortgage rates. Other government loan programs such as USDA and FHA loans can greatly aid homebuyers with favorable loan terms. Be sure to thoroughly review the qualifications of these loans before applying.
When it comes to down payments, it’s not twenty percent or bust. Granted, with a twenty percent down payment your lender won’t require you to purchase mortgage insurance; but even if you’re short, there are a number of alternatives to private mortgage insurance (PMI) available to you, such as Lender-Paid Mortgage Insurance and a piggyback loans strategy. Work with your agent to identify trusted lenders in their network that can help you secure the right loan.
A buyer’s agent will help you to identify which homes you can afford, work with you on formulating a competitive offer and preparing for negotiations with sellers and listing agents. Buyer’s agents will also handle the paperwork when it comes time to close the deal. A home purchase is an intricate transaction with many moving parts and having an experienced professional by your side who can navigate each step is invaluable. Typically, the buyer’s agent splits the commission of the sale with the listing agent, which is paid by the seller, so generally their services come at no additional cost to you.
Regardless of whether you’re buying a fixer-upper or a home that needs a few simple upgrades, you can usually expect some repair and remodeling expenses once the home is yours. Before you start swinging hammers or tearing up drywall, take time to assess the scope of the projects and whether you can do them yourself or need a professional. Talk with your agent about which remodeling projects have the highest resale value for comparable homes in your area.
Buying a home without having it inspected opens the buyer up to added risk. Without a home inspection, you forego the ability to negotiate repairs and concessions with the seller. Getting a home inspection is a small investment and alerts you of any potential home disasters that may be on the horizon. However, this mistake comes with an aside. In a seller’s market where a high number of buyers are competing for a limited number of available listings, waiving the inspection contingency is a common tactic for buyers looking to make their offer stand out. Work with your agent to figure out what’s best for you and your situation.
It’s easy to get so focused on the purchase of the home that you forget about what it will cost to move there. Moving expenses can add up quickly, especially if you’ll be traveling across state lines or across the country. If you’re buying and selling a home at the same time, there’s also the question of where you’ll live in between closing on your current home and closing on your new one. If these costs aren’t accounted for, you can quickly be over budget before you set foot in your new home.


All of us at Windermere Real Estate are proud to kick off another season as the “Official Real Estate Company of the Seattle Seahawks.” Since 2016, we’ve partnered with the Seahawks to #TackleHomelessness by donating $100 for every Seahawks defensive tackle made in a home game. And for the third season in a row, the money raised will go to Mary’s Place, a non-profit organization dedicated to supporting homeless families in the greater Seattle area. Mary’s Place works to provide safe and inclusive shelter and services that support women, children, and families through their journey out of homelessness.
Mary’s Place’s mission and the work of the Windermere Foundation go hand-in hand. Last year, we were able to donate $32,100 which brought our #TackleHomelessness total to $160,300 donated over the past five seasons. We look forward to raising even more this year!
Interested in following along with our progress this season? Follow us on Facebook, Twitter, Instagram, and LinkedIn for updates. Go Hawks!


The history of home design is full of trends that have come and gone. A style may suddenly skyrocket in popularity, capturing the hearts of homeowners and designers everywhere, only to fade away just as quickly. Taking this into account, homeowners will often look to the pillars of home design that have stood the test of time when preparing to remodel or upgrade their home. It’s these elements of timeless home design that ensure the spaces in your home won’t go out of style, and when it comes time to sell, won’t hurt its resale value.
Subway tile is ubiquitous—and for good reason. Clean, simple, and elegant, these tiles make it the top backsplash choice for many kitchen renovations and bathroom remodels. The white surface brightens the space, making it feel clean and organized. Resilient and easy to clean, subway tile may be just what the designer ordered for your next home project.

Image Source: Getty Images
Penny tile has stayed relevant through the years, and not just for aesthetic reasons. Though penny tile is visually appealing, its many grout joints make it ideal material for slick and slippery surfaces such as the shower, bathtub, or bathroom floor. This practical function has kept penny tile at the forefront of homeowners and professional remodelers alike for decades. With many color combinations from black and white for a retro look to colorful mosaics for the more eclectic homeowners, there’s an option for everyone with penny tile. While it’s commonly used in bathrooms, penny tile is also great near fireplaces and kitchen backsplashes.

Image Source: Shutterstock – Image Credit: Berkay Demirkan
Known for its distinctive angular arrangement, herringbone has been a fixture of interior design for decades. Herringbone tile brings flair and texture to a space, and its repetitive pattern will help to liven up any room without pulling away from other points of interest. It is a popular choice as a backsplash on bathroom walls, behind vanities, or in shower stalls. For those seeking the cleanliness of subway tile but prefer more dramatic lines, herringbone may be the perfect choice for you.

Image Source: Getty Images
Checkerboard is one of those rare designs that has the ability to continually reinvent itself. It carries a vintage charm but is also often found in aspects of modern design. It’s simultaneously formal and fun. Out of all the timeless tile designs, checkerboard is perhaps the most flexible. The design can make a great impact on the floors in a space as small as a bathroom yet is bold enough to make a statement in a larger surface area like a foyer.

Image Source: Getty Images
Though there is a certain geometry to all the previously mentioned designs, hexagonal (or honeycomb) tile’s unique shape gives it its trademark pattern. There are several variants of hexagonal tile, including stretched hex and picket tile, that can deliver that timeless feel you’re looking for while breaking up the monotony of rectangular lines in your home. Hexagonal patterns are bold and eye-catching, yet their patterns can provide a sense of calm and orderliness. Whether you decide to use it as a backsplash, shower tile, or floor tile, Hexagon tiles will add intrigue to the space.

Image source: Getty Images
The right tile may be just the ingredient you need to tie your home together. It can make a surprising difference in your next remodel, so it’s worth your time to explore the many different options available before making your decision. For more on timeless home design, find out which 7 Vintage Design Elements are still popular today.

Hello there! I’m Windermere Real Estate’s Chief Economist, Matthew Gardner, and welcome to the latest episode of Mondays with Matthew.
Today we are going to take a look at the latest Home Purchase Sentiment Index survey that was just put out by Fannie Mae. And for those of you who may not be familiar with this survey, it’s actually pretty important and one that I track closely as it’s the only national, monthly, survey of consumers that’s focused primarily on housing.
The survey shows the responses of 1,000 consumers across the country to roughly 100 survey questions on a wide range of housing-related topics. Now, don’t worry, we aren’t going to look at all 100 questions – just the ones that solicit consumers’ evaluations of housing market conditions and that also address topics related to their home purchase decisions.
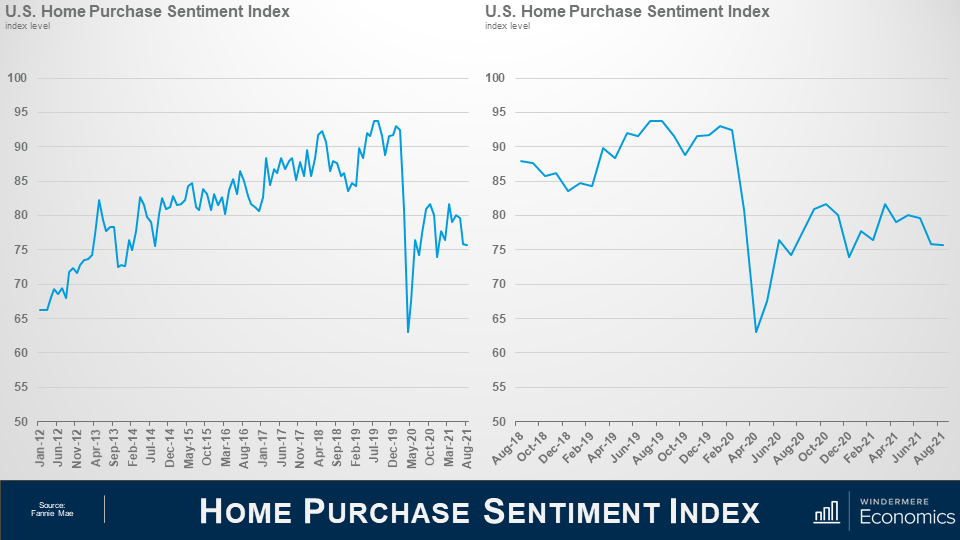
So, as you can see here, the overall index was trending higher pretty consistently until the pandemic happened which had massive, but temporary, impacts. And looking the last 3-years, you can get a better idea as to the speed of the pandemic induced drop – pretty remarkable.
Now, you will also see that the index recovered quite quickly; however, it fell again last fall as the pandemic was not going away at the speed many had hoped for – it rose again this spring but has been pulling back for the past few months but, that said, the August index level essentially matched the level seen in July.
Now let’s look at the questions that are used to create of the index number and how consumers responded.
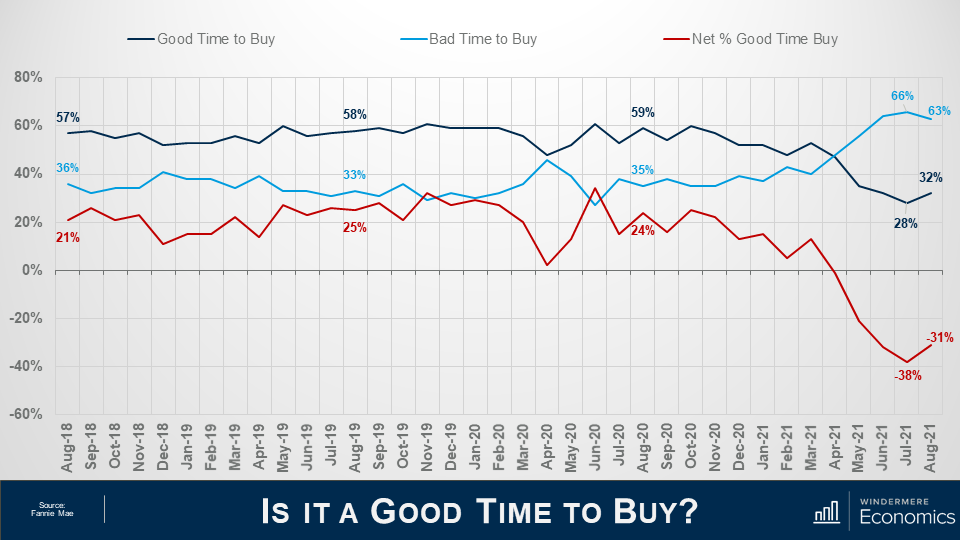
When asked whether it was a good time to buy a home, the percentage who agreed with that statement rose from 28 to 32%, while the share who thought that it is a bad time to buy dropped from 66 to 63%. And, as a result, the net share of those who say it is a good time to buy jumped 7 points month over month and its notable that this is the first time the net share number has improved in the past 4-months.
What I see here is that – although improving modestly, the general consensus is that it is not a good time to buy and that sentiment is being driven by two things: One – there are still not enough homes on the market, and two, rapidly rising prices are scaring some people.
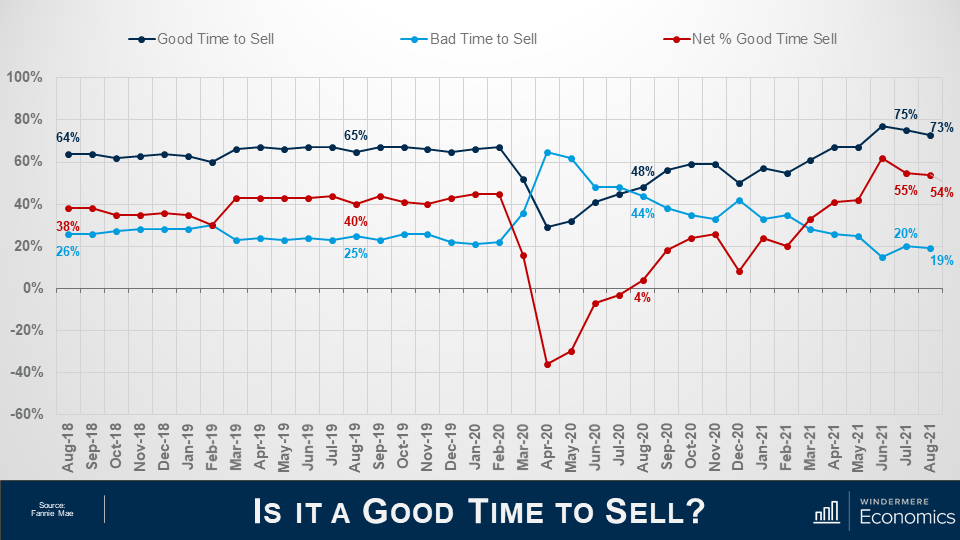
And when asked if they thought it was a good time to sell their homes it was interesting to see that share drop from 75 to 73% while the percentage who said that it’s a bad time to sell dropped 1 point to 19% and as a result, the net share of those who said it was a good time to sell pulled back by 1% but it still indicates that more owners think that it is a good time to sell than don’t.
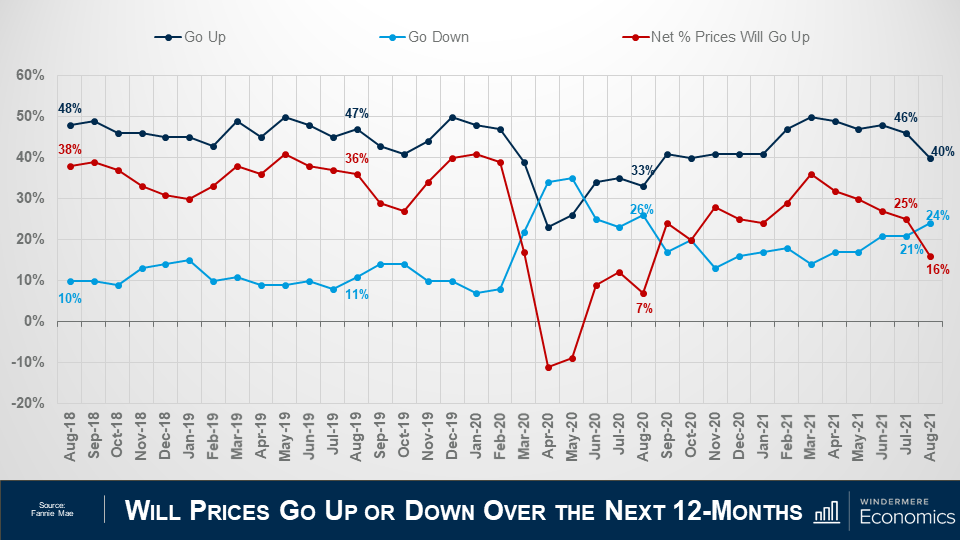
Looking now at the direction of home prices over the next 12-months, the percentage who think that home prices will rise fell from 46 to 40%, while the percentage who expected home prices to drop rose from 21 to 24%.
As a result, the net share of Americans who say home prices will go up dropped by 9 points – from 25%, down to 16%.
Although this may sound concerning, I should add that the share of respondents who thought that home prices will remain static over the next year rose from 27% to 31%.
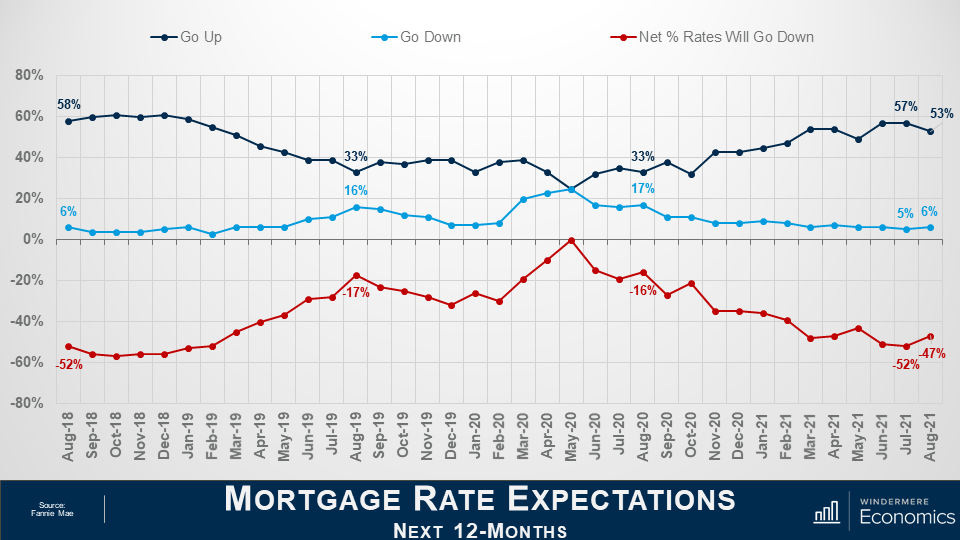
On the financing side, the share who think mortgage rates will rise over the next 12 months dropped from 57 to 53%, while the percentage who believed rates would be lower rose from 5% to 6% and, as a result, the net share of Americans who believed that mortgage rates will go down over the next 12 months rose by 5%, and with 35% of respondents thinking that that rates will hold steady – it’s clear to me that a vast majority are not worried about mortgage rates rising.
The takeaways for me so far are that consumers tempered both their recent pessimism about homebuying conditions and their upward expectations of home price growth.
Most notably, a greater share of consumers believe that it’s a good time to buy a home – though that population remains firmly in the minority at only 32% – while the ongoing plurality of respondents who expect home prices to go up over the next 12 months dropped but was still well above the 24% of consumers who believe home prices will fall.
Now, there are two more questions that are worth looking at which aren’t directly related to home buyers and sellers but are still important as they look at employment and incomes.
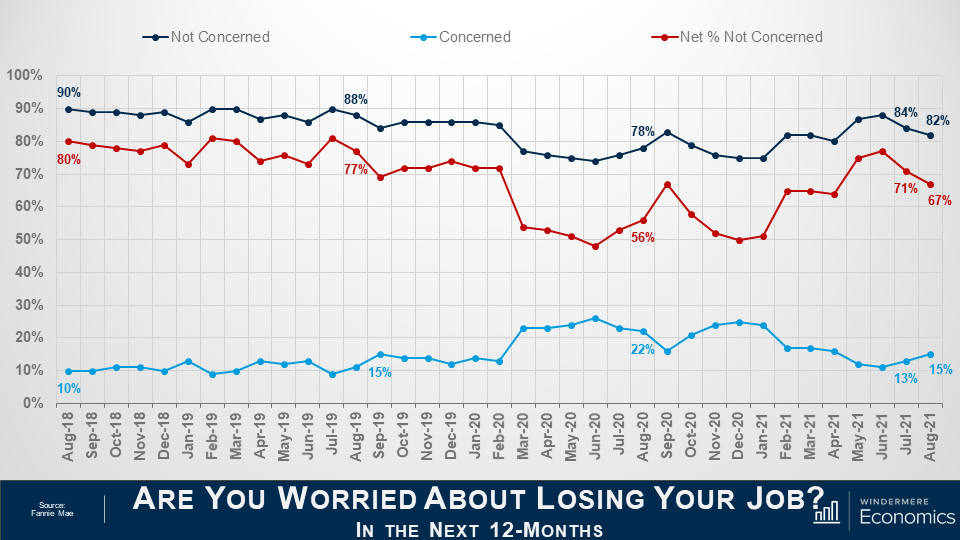
The percentage of respondents who said that they are not concerned about losing their job in the next 12 months remains very high at 82%, but it did drop by 2 points month-over-month, while the percentage who said that they are concerned ticked up to 15% from 13%. As a result, the net share of Americans who say they are not concerned about losing their job fell by 4 percentage points month over month, but remains well above the level seen a year ago.
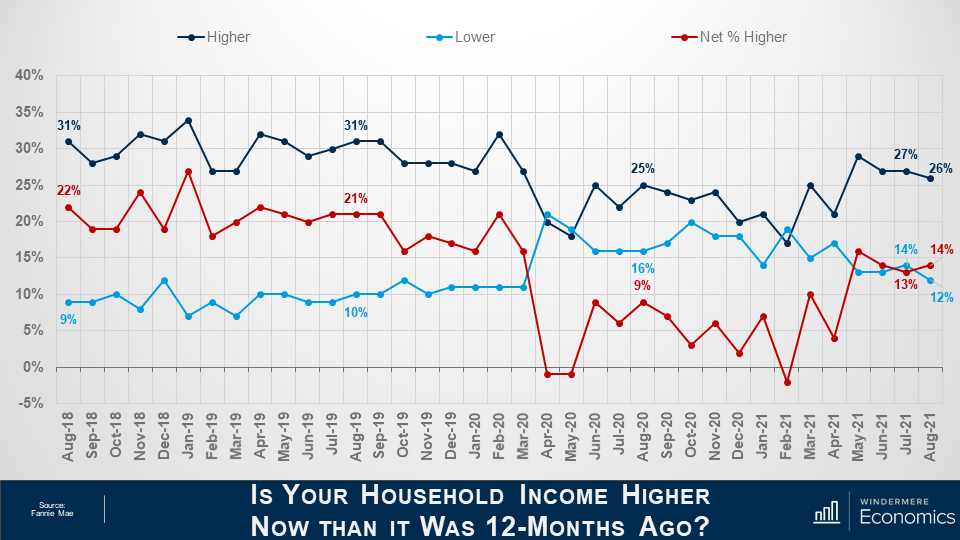
And finally, when households were asked about their own personal finances, the percentage of respondents who said that their household income is significantly higher now than it was 12 months ago pulled back one point to 26%, while the percentage who said that their household income is significantly lower dropped to 12%.
As a result, the net share of those who said that their household income is significantly higher than it was a year ago rose by 1 percent month over month and came in 5 points higher than a year ago. It’s also worthwhile noting that most said that their household income is about the same as it was a year ago with that share rising from 56 all the way up to 59%.
Looking at all the numbers in aggregate, the index level was relatively flat in August with three of the index’s six components rising month over month, while the other three fell, and that tells me that the continued strength of demand for housing and definitely favorable conditions for home sellers may well be offsetting broader concerns about the Delta variant of COVID-19 as well as rising inflation that have both negatively impacted other consumer confidence indices.
Most consumers continued to report that it’s a good time to sell a home – but a bad time to buy – and they most frequently cite high home prices and a lack of supply as their primary rationale.
However, the ‘good time to buy’ component, while still near a survey low, did tick up for the first time since March, perhaps owing in part to the very favorable mortgage rate environment as well as growing expectations that home price appreciation will begin to moderate over the next year. A sentiment that I personally agree with.
Well, I hope that you have found this month’s discussion to be interesting. As always if you have any questions or comments about this topic, please do reach out to me but, in the meantime, stay safe out there and I look forward the visiting with you all again, next month.


