It can be difficult for sellers to distinguish between two methods of finding the value of their home: a Comparative Market Analysis (CMA) and a home appraisal. Though they share many similarities, there are key differences in how the two approaches ultimately arrive at a listing price for your home.
The Difference Between a Comparative Market Analysis and an Appraisal
Comparative Market Analysis (CMA)
A CMA is conducted by an agent using their knowledge of the local market in conjunction with information available to them on the multiple listing service (MLS), which contains data on sold homes and market trends. A CMA helps to price the home more accurately, keeping the property competitive in the current market. For those who are thinking of selling their home For Sale By Owner (FSBO), it’s worth noting that you will not be able to conduct a CMA on your own, since, among other things, access to the MLS is exclusive to real estate agents.
Your agent’s analysis accounts for the various factors that influence home prices to arrive at an accurate estimate of your home’s value. A CMA compares your home to others in your area that have either recently sold, are currently on the market, or had previously listed but have since expired, typically using data from the past three-to-six months. Comparable homes, or “comps,” are homes whose characteristics are similar to your own, such as the housing type, condition, and the square footage and property size. A thorough CMA will provide information on what homes in your area are selling for, how long they were on the market, and the difference between their listing and sold price, and will list a low, median, and high selling price for your home.
Appraisal
The main difference between an appraisal and a CMA is the personnel involved. Whereas a CMA is conducted by a real estate agent, an appraisal is carried out by a licensed appraiser on behalf of the bank. Once a buyer applies for a loan to purchase your home, the bank will order an appraisal of the property. Though appraisers use methods of comparison similar to an agent’s CMA, unlike a real estate agent, bank appraisers have no vested interest in the sale of the home. The goal of an appraiser’s visit is to determine your home’s fair market value to ensure that the bank isn’t lending more money to the buyer than needed.
At long last, it appears the skyrocketing home prices that have stymied buyers may be cooling.
Also, an increase in condo sales indicates that city living is back in demand.
When the stress of the modern world gets to be too much, there’s nothing quite like a comforting weekend away to decompress. Embrace cozy flannel, pumpkin spice and the simple life with these cabin escapes to inspire you this fall.
JUST SOLD
Address: 3073 71st Ave SE Mercer Island, WA 98040
A RARE GEM! Enjoy spectacular sunsets, stunning city & shimmering lake views. A salute to Mid-Century modern in the coveted neighborhood of First Hill. Dramatic great room concept with walls of glass and stellar 180+ degree views from Seward Park to the south, and the City to the west. The great room opens to the spacious deck, creating an elegant flow from the indoors to the outdoors. Sit with your wine or coffee, kick back and enjoy a moment’s quiet time or the full Blue Angels show! Recently refreshed & modernized. The lower floor opens out to a private backyard. Fabulous street, with many newer homes. Terrific opportunity to enjoy luxury living & killer views at an affordable price! Minutes to I-90, & DT Seattle/Bellevue.
A new startup is offering an innovative solution to provide shelter for those in need
and make use of underutilized spaces. These “City Pods” are effecient housing units
that can be placed inside larger buildings.
The show must go on! After a long hiatus during the pandemic, theater, concerts and
performances of all kinds have returned to the stage.
We’ve gathered some upcoming shows for you to experience a night at the theater.
The following analysis of the Western Washington real estate market is provided by Windermere Real Estate Chief Economist Matthew Gardner. We hope that this information may assist you with making better-informed real estate decisions. For further information about the housing market in your area, please don’t hesitate to contact your Windermere Real Estate agent.
REGIONAL ECONOMIC OVERVIEW
Employment levels in Western Washington picked up in the late spring and early summer months. The region has now recovered 168,800 of the 297,210 jobs that were lost due to the pandemic. Although the recovery is palpable, there are still 128,000 fewer jobs than there were at the pre-COVID peak in February 2020. The most recent data (May) shows the region’s unemployment rate at a respectable 5.2%. This is significantly lower than the April 2020 high of 16.8%, but still not close to the 2020 low of 3.7%. The jobless rate was lowest in King County (4.8%) and highest in Grays Harbor County (7.6%). Although unemployment levels continue to drop, we cannot attribute all the improvement to job creation: a shrinking labor force also lowers the jobless rate. In short, job recovery continues but we still have a way to go.
WESTERN WASHINGTON HOME SALES
❱ Regardless of low levels of supply, sales in the second quarter rose 45.6% year-over year, with a total of 25,640 homes sold. Although comparisons to the same quarter a year ago are not informative due to the pandemic, I was pleased to see sales increase 61.3% from the first quarter of this year.
❱ Listing activity was 42.8% higher than in the first quarter, which was a pleasant surprise. Listings rose the most in Kitsap, Clallam, Island, and Mason counties, but there were solid increases across the region.
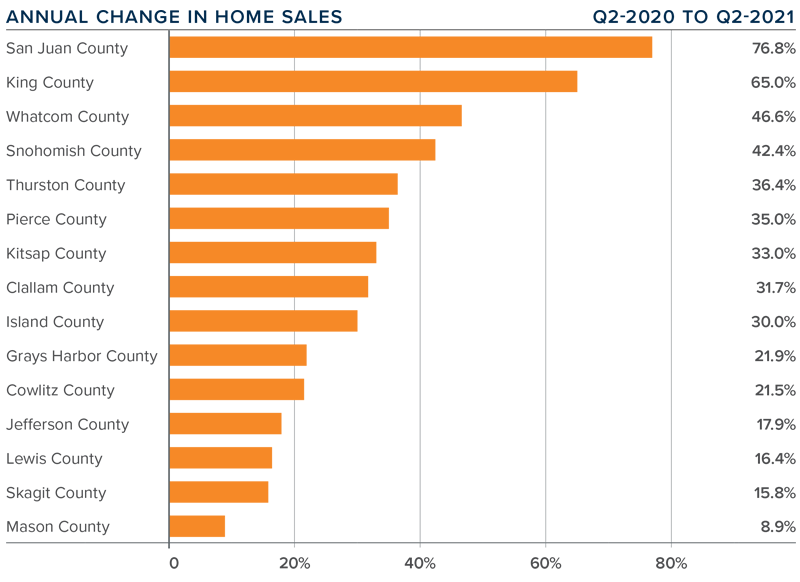
❱ Sales were up across the board, with sizable increases in San Juan, King, Whatcom, and Snohomish counties. Only Mason County experienced sales growth below 10%.
❱ Pending sales (demand) outpaced active listings (supply) by a factor of 6. Even with the increase in the number of homes for sale, the market is far from being balanced.
WESTERN WASHINGTON HOME PRICES
❱ Home prices rose 31.4% compared to a year ago. The average sale price was $734,567—another all-time record.
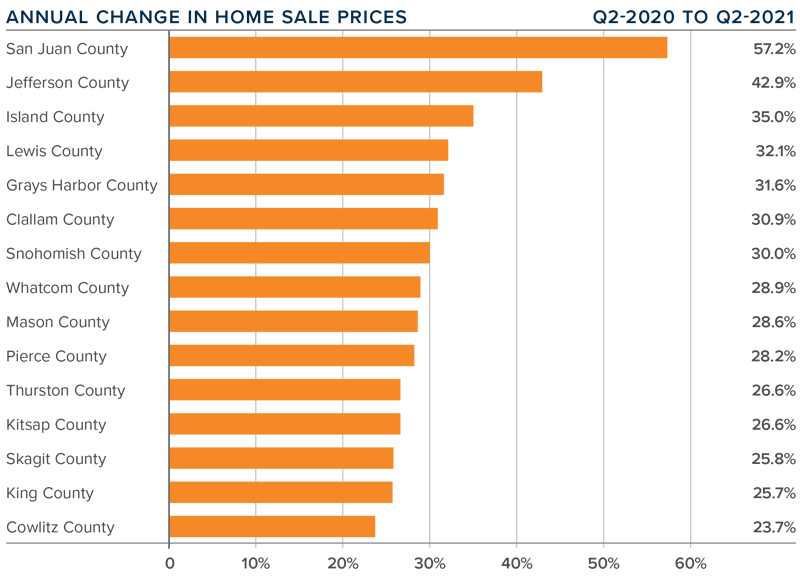
❱ Year-over-year price growth was strongest in San Juan and Jefferson counties, but all markets saw prices rise more than 23% from a year ago.
❱ Home prices were a remarkable 15.7% higher than in the first quarter of this year, possibly due in part to the drop in 30-year fixed mortgage rates between the end of the first and second quarters. That said, the modest decline in mortgage rates is certainly not the primary driver of price growth; the culprit remains inadequate supply.
❱ Relative to the first quarter of the year, San Juan (+33%), Jefferson (+24.7%), and Island (+20.5%) counties saw the fastest rate of home-price appreciation.
DAYS ON MARKET
❱ It took an average of only 18 days for a listed home to go pending. This was 22 fewer days than a year ago, and 11 fewer days than in the first quarter of 2021.
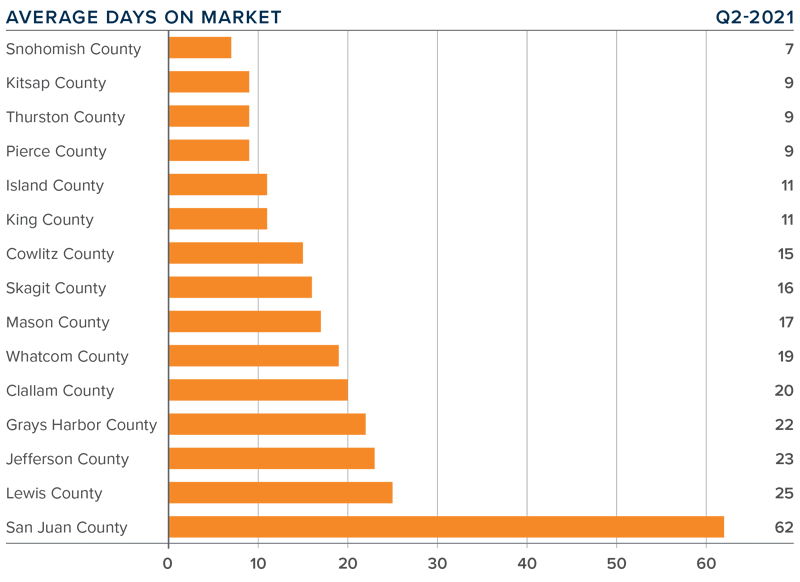
❱ Snohomish, Kitsap, Thurston, and Pierce counties were the tightest markets in Western Washington, with homes taking an average of only 7 days to sell in Snohomish County and 9 days in the other three counties. The greatest drop in market time compared to a year ago was in San Juan County, where it took 84 fewer days to sell a home.
❱ All counties contained in this report saw the average time on market drop from the same period a year ago. The same can be said when comparing market time in the current quarter with the first quarter.
❱ It’s widely known that the area’s housing market is very tight and unfortunately, I don’t expect the number of listings to increase enough to satisfy demand in the near term. Furthermore, I’m seeing rapid growth in demand in the counties surrounding King County which is likely proof that buyers are willing to move further out given the work-from-home paradigm shift.
CONCLUSIONS
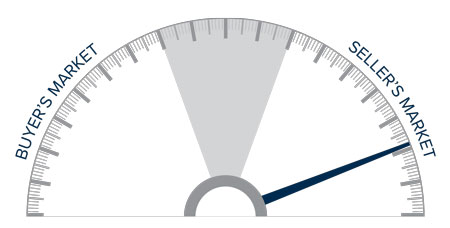
This speedometer reflects the state of the region’s real estate market using housing inventory, price gains, home sales, interest rates, and larger economic factors.
Demand is maintaining its momentum, and, even with supply levels modestly improving, the market remains extraordinarily tight.
Mortgage rates are still hovering around 3%, but the specter of them starting to rise at some point is clearly motivating buyers. I am very interested to see significant interest outside of the Seattle metro area, although King County is certainly still performing well. I will be monitoring whether this “move to the ‘burbs” is endemic, or a temporary phenomenon. My gut tells me that it is the former.
At some point, the remarkable run up in home values will slow. Affordability constraints are becoming more widespread, and even a modest uptick in mortgage rates will start to slow down price increases. It’s worth noting that list-price growth is starting to taper in some markets. This is a leading indicator that may point to a market that is starting to lose a little momentum.
The bottom line is that the market still heavily favors sellers and, as such, I am moving the needle even more in their favor.
ABOUT MATTHEW GARDNER
As Chief Economist for Windermere Real Estate, Matthew Gardner is responsible for analyzing and interpreting economic data and its impact on the real estate market on both a local and national level. Matthew has over 30 years of professional experience both in the U.S. and U.K.
In addition to his day-to-day responsibilities, Matthew sits on the Washington State Governors Council of Economic Advisors; chairs the Board of Trustees at the Washington Center for Real Estate Research at the University of Washington; and is an Advisory Board Member at the Runstad Center for Real Estate Studies at the University of Washington where he also lectures in real estate economics.
It’s easy to get into a routine when cleaning your home season after season, year after year. While simply going over the same spots may make your home feel cleaner, at the same time, it allows the neglected areas to become dirtier. Here are six commonly missed spots around the home that, once given the attention they deserve, will help make your home feel completely clean.
6 Commonly Missed Cleaning Spots
1. Underneath & Behind Furniture
Dirt and dust love to hide in tough-to-reach, tucked-away spots like behind your nightstand, under your bed frame, and on the underside of your tables, chairs, and couches. Cleaning these areas may require some heavy lifting and rearranging but it’s worth your while. If enough dust and grime have accumulated over the years that your vacuum can’t remove the buildup, try using a washcloth to loosen the sediment.
2. Vents and Fans
Vents and fans not only collect dust, but they also distribute it around your home. Ceiling fans are one of the hardest spots in your home to reach, so you may need to use a ladder and an extended duster to clean them. Clean your vent grates with a dusting brush or a wire brush depending on the thickness of the buildup. If your home has central air, remember to replace your air filters periodically. A clean ventilation system is key to protecting your home’s air quality.
3. Bathroom Surfaces
We all know the feeling of picking up a rarely used shampoo bottle in the shower to discover a grimy ring underneath it. Wipe off your bottles and surfaces in the shower to keep it sparkling clean. Scrub away the debris from your shower head and soak it in a mixture of water and white vinegar to cleanse the device and to prevent a buildup of mineral deposits. To reach behind the toilet, you may need knee pads and an extended cleaning tool. Use a disinfectant-water mixture to prevent the spread of germs. Tackling chores like these will help make your bathroom feel brand new in no time.
Image Source: Getty Images
4. Switches & Handles
Light switches, door handles, drawer pulls, and knobs are all hotbeds for germs and dirt and can easily be forgotten while cleaning your home. Take a two-step approach to cleaning these high-touch surfaces: first clean, then disinfect. Cleaning will get rid of contaminants, while disinfecting targets pathogens. The combination of the two will help make your home feel cleaner while reducing the spread of germs. Other high-touch surfaces such as keyboards, phones, tablets, and other devices require regular cleaning as well.
5. Appliances
It’s easy to think of your appliances strictly as devices that help your home stay clean and organized, but they are magnets for dirt and gunk, too. After cleaning out the refrigerator and scrubbing down the shelves, find the coils and clean them of debris with a vacuum or a brush. The floor underneath your refrigerator can be a seriously grimy spot, so a quick mop of that area is worth your while. Give your dishwasher a good cleanse to prevent mold buildup and bad odors. Remember to clean out the filter occasionally with soap and water. Cleaning your appliances routinely can help avoid repairs and can even extend their life expectancy.
6. Baseboards
Baseboards are the perfect settling point for dirt and dust. The space between your walls and floors is an easy trap for buildup, and upon closer inspection, you’ll find some combination of scuffs, dust, food remnants and scratch marks. To thoroughly clean your baseboards, you may need to move your furniture away from the walls but be careful not to scratch the floor or damage the baseboards. Wipe away the dust before cleaning the surface. Use either a mix of soap and water, water and vinegar, or the proper wood cleaner for wooden baseboards.
Understanding the housing market is a matter of analyzing its many data sets. In a recent piece for Inman News, Windermere Chief Economist Matthew Gardner offered his perspective on recent U.S. pending sales, new-home sales, and existing-home sales figures.
If you’re involved in the housing market, and I assume that most of you are, you know very well that this is a numbers business. All of us are surrounded by housing-related data day in and day out, and it can become a little overwhelming at times — even for an economist like myself.
Well, today I’d like to take a few minutes to talk about just a couple of the datasets that I think are particularly important to track and offer you my perspectives on them.
Housing
There’s no doubt that the ownership housing market really was a beacon of light as we moved through the pandemic period. Even though the market paused last spring as COVID-19 hit the nation, it snapped back remarkably quickly, unlike many other parts of the U.S. economy that are still suffering today.
This is important, as housing is a significant contributor to the broader economy. For example, last year, spending on the construction of new homes, residential remodeling and real estate brokers fees amounted to around $885 billion or 4.2 percent of gross domestic product.
But the real number is far greater than that when you add in all spending on all household services. The total amount of money spent on housing in aggregate was around $3.7 trillion or 17.5 percent of the country’s economy.
So, we know that the housing market is a very important part of our economy, but can that number continue to grow? Let’s take a look.
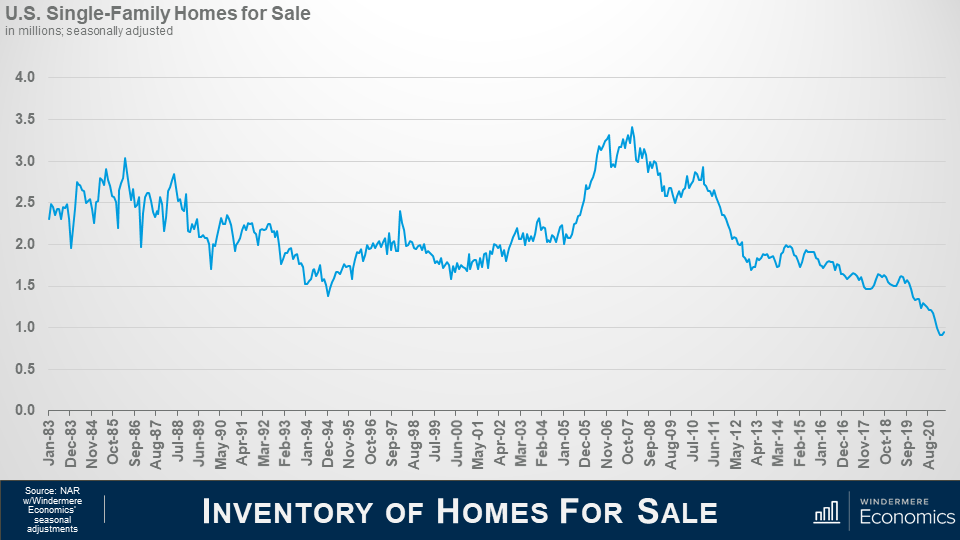
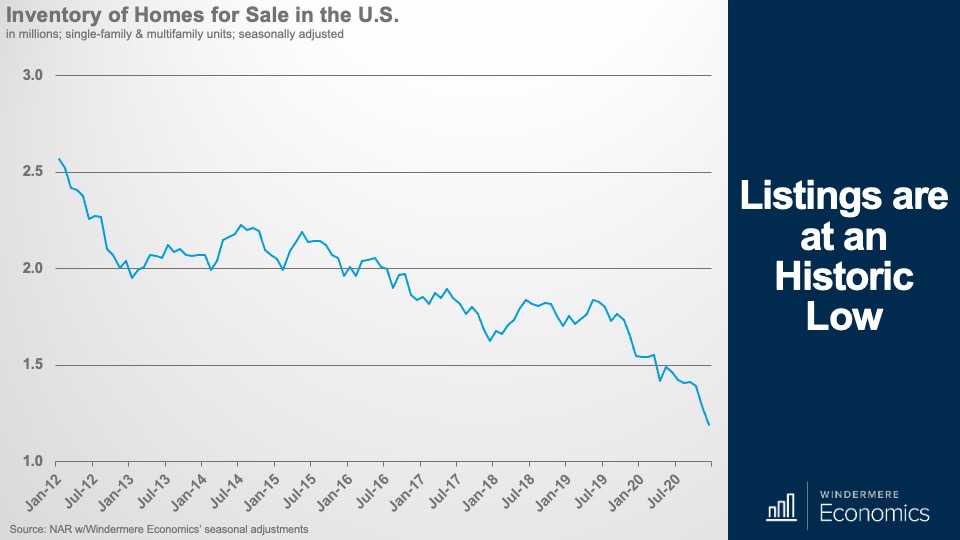
Inventory
The chart below shows the number of single-family homes for sale going back to 1983. As you can clearly see, there’s never been a time — at least since records were kept at the national level — where they were fewer homes for sale at any one time.
And this is a problem because the biggest issue the market faces today is that demand for homes is far exceeding supply.
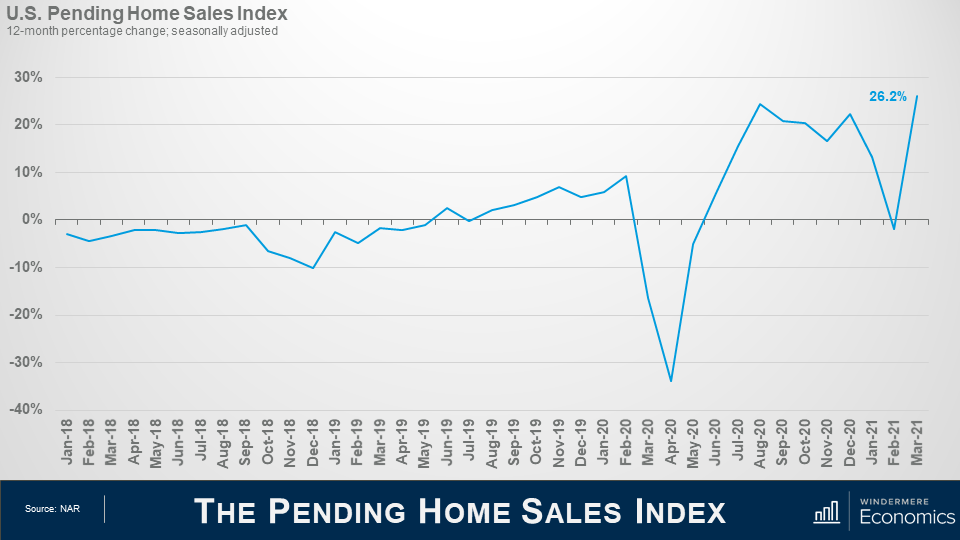
A report I track very carefully — and I am sure that many of you do, too — is the National Association of Realtors pending home sales index, which is shown below.
Although it’s not a perfect indicator, as the survey only covers about 20 percent of all homes that go pending, it does give us a pretty good idea as to what the future may hold given that, all things being equal, about 80 percent of pending homes close within roughly two months, making it a leading indicator.
You can clearly see the massive pull back last spring because of the pandemic, but this was very quickly followed by a very significant surge.
It pulled back again last winter, but I would suggest that this was more a function of lack of homes for sale than anything else. However, look at the March spike.
Now, you might be thinking that this is a great number, but I would caution all of you not to pay too much attention to year-over-year changes, as they can be deceiving. You see, the index jumped because it was being compared with last March when the pandemic really started.
Closed sales
When we look at closed sales activity, it actually lines up pretty well with the pending home sales index, which fell in January and February. This is reflected in the contraction in closed sales that we saw this spring. And if the index is accurate, it suggests we may see closed sales activity pick up again over the next couple of months.
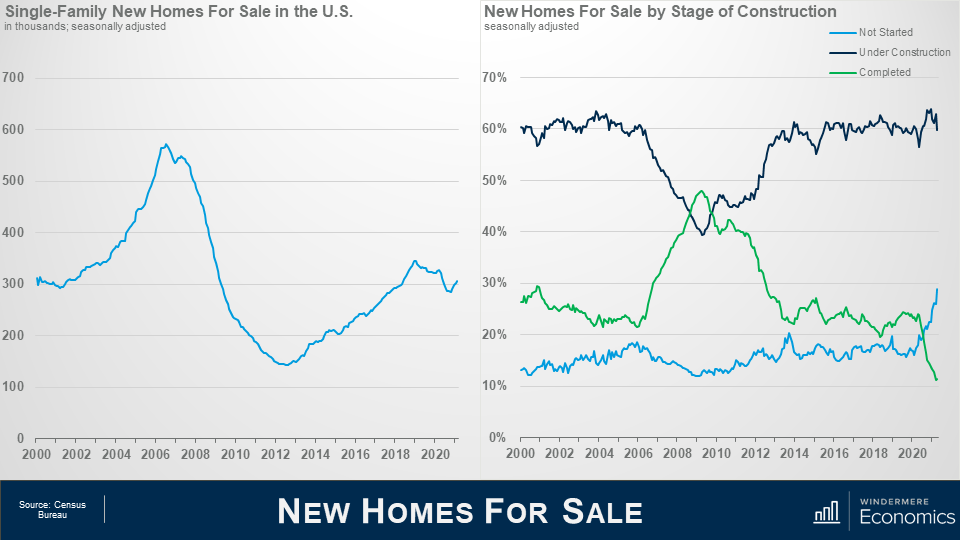
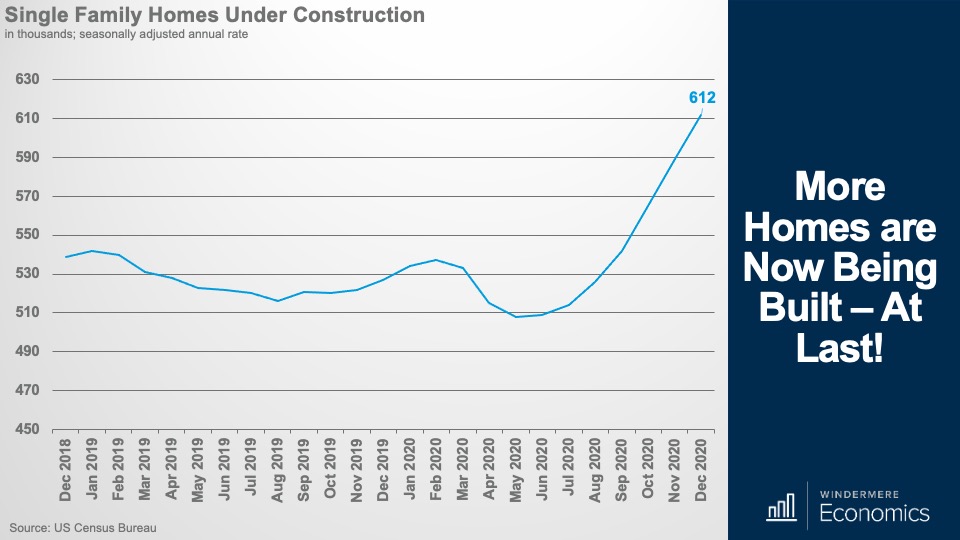
Of course, any time where housing demand exceeds supply, there is a solution — and that would be to build more homes.
But as you can see here, though more homes started to be built as we emerged from the financial crisis, the number today is essentially the same as it was two decades ago and has been declining for the past two years.
That’s significant, as the country has added over 12 million new households during the same period which has further fueled demand for housing. If there are no new homes to buy, well, that does one thing — and that’s to put more focus on the resale market, which has already led to very significant price increases.
New home market
But this particular report also offers some additional data sets, which I think give more clarity to the state of the new home market.
Before the housing market crashed, you can see that a majority of new homes that were on the market for sale were being built at that time, but — as the housing bubble was bursting — the market dropped, and the share of homes that were finished and for sale naturally rose.
But what I want you to look at is the far right of the chart above. You see the spike in the share of homes for sale that have not yet been started?
Well, given the massive increase in construction costs builders have, understandably, become far more cautious and are trying to sell more homes before they start to build them to mitigate some of the risk. It also tells me that they see demand that is not being met by the existing-home market and are looking to take it advantage of this.
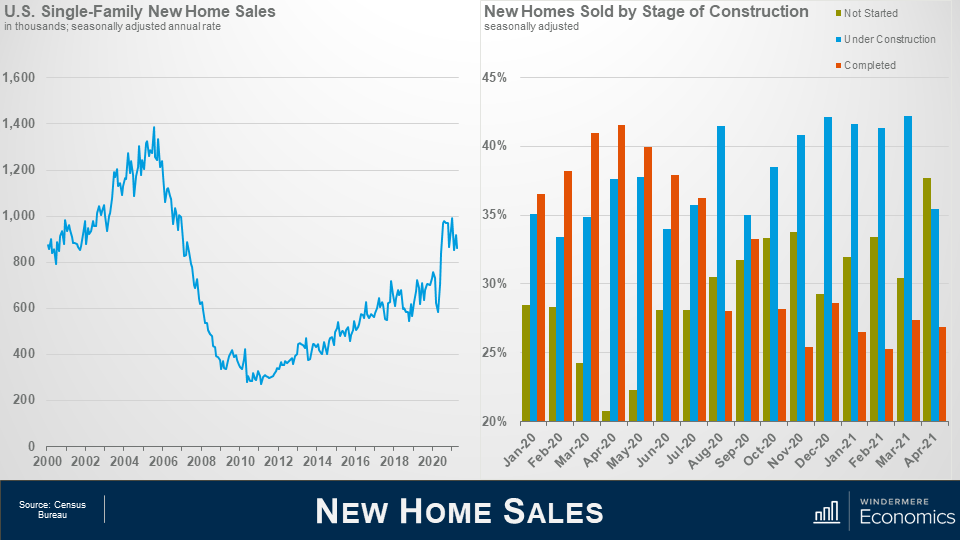
When we look at new home sales, you can see that the trend, in essence, follows the number of homes for sale, but I would caution you on a couple of things.
Firstly, these figures do not represent closed sales, as the Census Bureau, which prepares this dataset, considers a home sold once it has gone under contract. This makes sense, as a home can be sold before it has even broken ground. In essence, it’s more similar to NAR’s Pending Home Sales Index than anything else.
Look now at sales by stage of construction on the right. You can see that, as the pandemic was getting started, new homes that were ready to move into were what buyers wanted, and that accounted for over 42 percent of total new sales in April.
As the supply of finished homes dropped, homes that were being built took the lion’s share of sales — as they have done historically. However, look at April. The greatest share of sales — 37.7 percent — were homes that hadn’t yet been started.
Again, this supports the theory that builders remain cautious given ever-escalating costs, but it also shows that buyers’ needs are not being met by the resale market, so they were willing to wait, likely a considerable time, for their new home to be built.
Of course, the couple of datasets I’ve shared with you today are just the tip of the iceberg when it comes to the housing-related numbers you should all be tracking, as they can tell a story that can impact everyone involved in the development or sale of homes.
Mortgage rates
In addition to the data we have discussed today, you should be well versed in mortgage rate trends, demographic shifts, building permit activity and the economy in general — and you need to understand all these numbers at a local as well as national level.
For the vast majority of households, buying a home will be the most expensive thing that they will ever purchase in their lives. And given memories of the housing crash, as well as the significant increase in home prices that we’ve seen since last summer, it’s now more important than ever for you to be able to share your knowledge with your clients and be able to advise them accordingly.
Windermere’s Chief Economist, Matthew Gardner, often contributes to local and national publications with his insights to the housing market. Recently he offered his analysis of home sales numbers to Inman News, this is a repost of that video and article.
For more market news and updates from Matthew Gardner,
The following analysis of the Western Washington real estate market is provided by Windermere Real Estate Chief Economist Matthew Gardner. We hope that this information may assist you with making better-informed real estate decisions. For further information about the housing market in your area, please don’t hesitate to contact your Windermere Real Estate agent.
REGIONAL ECONOMIC OVERVIEW
In the summer and fall of 2020, Western Washington regained some of the jobs lost due to COVID-19, but employment levels in the region have been in a holding pattern ever since. As of February, the region had recovered 132,000 of the 297,000 jobs that were lost, but that still leaves the area down by 165,000 positions. Given the announcement that several counties may have to roll back to phase 2 of reopening, I would not be surprised to see businesses hold off on plans to add to their payrolls until the picture becomes clearer. Even with this “pause” in the job recovery, the region’s unemployment rate ticked down to 6.1% from the December rate of 6.4% (re-benchmarking in 2020 showed the December rate was higher than the originally reported 5.5%). The lowest rate was in King County (5.3%) and the highest rate was in Grays Harbor County, which registered at 9.2%. Despite the adjustment to the 2020 numbers, my forecast still calls for employment levels to increase as we move through the year, though the recovery will be slower in areas where COVID-19 infection rates remain elevated.
WESTERN WASHINGTON HOME SALES
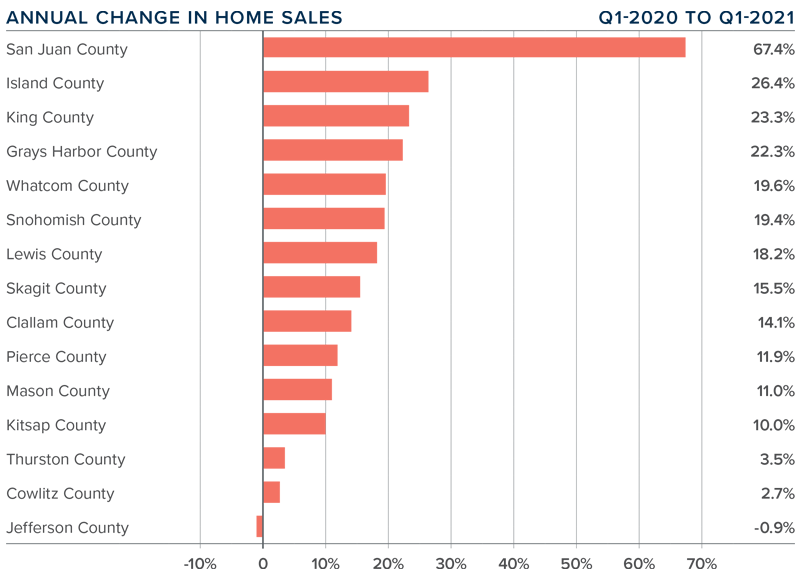
❱ Sales in the first quarter were impressive, with 15,893 home sales. This is an increase of 17.5% from the same period in 2020, but 32% lower than in the final quarter of last year—a function of low levels of inventory.
❱ Listing activity continues to be well below normal levels, with total available inventory 40.7% lower than a year ago, and 35.5% lower than in the fourth quarter of 2020.
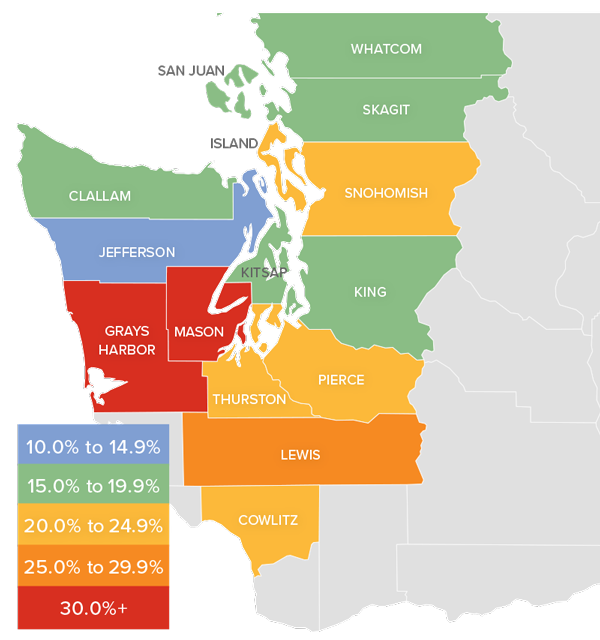
❱ Sales rose in all counties other than Jefferson, though the drop there was only one unit. There were significant increases in almost every other county, but sales growth was more muted in Cowlitz and Thurston counties. San Juan County again led the way, likely due to ongoing interest from second-home buyers.
❱ The ratio of pending sales (demand) to active listings (supply) shows how competitive the market is. Western Washington is showing pendings outpacing new listings by a factor of almost six to one. The housing market is as tight now as I have ever seen it.
WESTERN WASHINGTON HOME PRICES
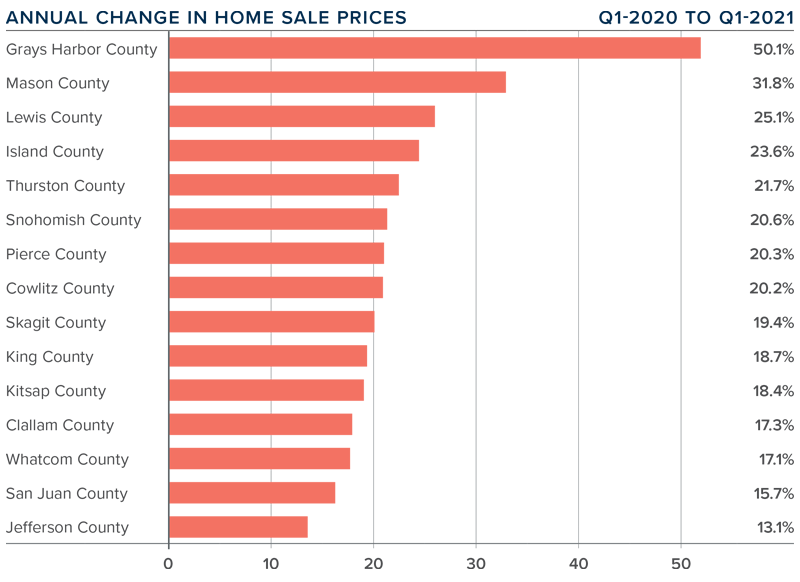
❱ Home price growth in Western Washington continues to trend well above the long-term average, with prices 21.3% higher than a year ago. The average home sale price was $635,079.
❱ Compared to the same period a year ago, price growth was strongest in Grays Harbor and Mason counties, but all markets saw double-digit price growth compared to a year ago.
❱ Home prices were also 2.9% higher than in the final quarter of 2020, which was good to see given that 30-year mortgage rates rose .4% in the quarter.
❱ I expect to see mortgage rates continue to trend higher as we move through the year, but they will remain significantly lower than the long-term average. Any increase in rates can act as a headwind to home-price growth, but excessive demand will likely cause prices to continue to rise.
DAYS ON MARKET
❱ The market in early 2021 continued to show far more demand than supply, which pushed the average time it took to sell a home down 25 days compared to a year ago. It took 2 fewer days to sell a home than it did in the final quarter of 2020.
❱ Snohomish and Thurston counties were the tightest markets in Western Washington, with homes taking an average of only 15 days to sell. The greatest drop in market time was in San Juan County, where it took 52 fewer days to sell a home than it did a year ago.
❱ Across the region, it took an average of only 29 days to sell a home in the quarter. All counties saw market time decrease from the first quarter of 2020.
❱ Very significant demand, in concert with woefully low levels of supply, continues to make the region’s housing market very competitive. This will continue to be a frustration for buyers.
CONCLUSIONS
This speedometer reflects the state of the region’s real estate market using housing inventory, price gains, home sales, interest rates, and larger economic factors.
Demand is very strong and, even in the face of rising mortgage rates, buyers are still out in force. With supply still lagging significantly, it staunchly remains a seller’s market. As such, I am moving the needle even further in their favor.
As I mentioned in last quarter’s Gardner Report, 2021 will likely see more homeowners make the choice to sell and move if they’re allowed to continue working remotely. On the one hand, this is good for buyers because it means more listings to choose from. However, if those sellers move away from the more expensive core markets into areas where housing is cheaper, it could lead to increased competition and affordability issues for the local buyers in those markets.
ABOUT MATTHEW GARDNER
As Chief Economist for Windermere Real Estate, Matthew Gardner is responsible for analyzing and interpreting economic data and its impact on the real estate market on both a local and national level. Matthew has over 30 years of professional experience both in the U.S. and U.K.
In addition to his day-to-day responsibilities, Matthew sits on the Washington State Governors Council of Economic Advisors; chairs the Board of Trustees at the Washington Center for Real Estate Research at the University of Washington; and is an Advisory Board Member at the Runstad Center for Real Estate Studies at the University of Washington where he also lectures in real estate economics.
This video is the latest in our Monday with Matthew series with Windermere Chief Economist Matthew Gardner. Each month, he analyzes the most up-to-date U.S. housing data to keep you well-informed about what’s going on in the real estate market.
Hello there. I am Windermere Real Estates Chief Economist, Matthew Gardner, and welcome to the March episode of Mondays with Matthew.
Well, we have lots to talk about this month so let’s get straight to it and, first off, let’s take a look at the February existing home sales numbers.
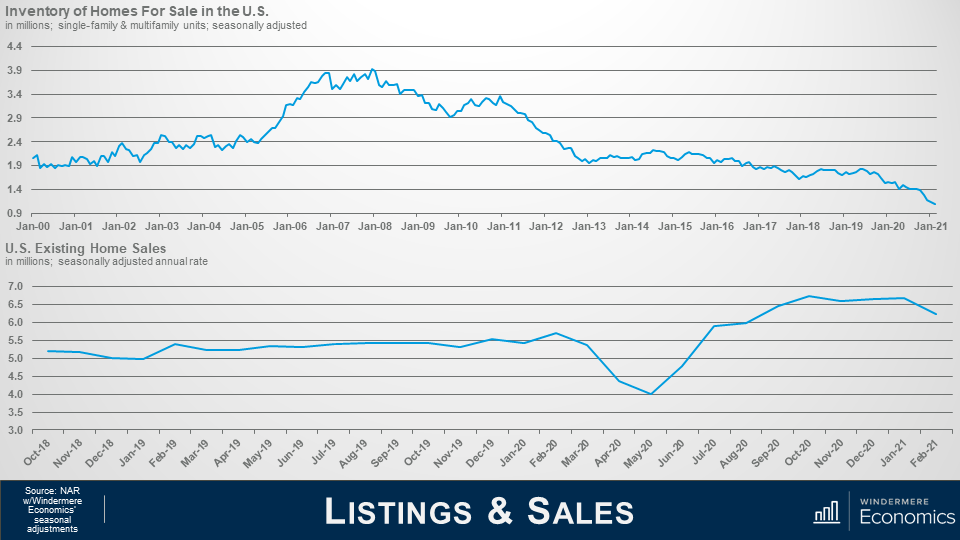
Listings and Sales. Source: NAR with Windermere Economics Seasonal Adjustments
As you can see in the top chart, the number of homes for sale was measured at just over 1 million units. This is a woefully low number and one that we haven’t seen since NAR started to gather data on listing inventory.
And the bottom chart shows home sales and they fell by 6.6% month-over-month in February to a seasonally adjusted annual rate of 6.22 million units but they were still 9.1% higher than a year ago.
Why the drop? Well, I am putting the blame squarely on the shoulders of home sellers who – quite frankly – simply aren’t selling!
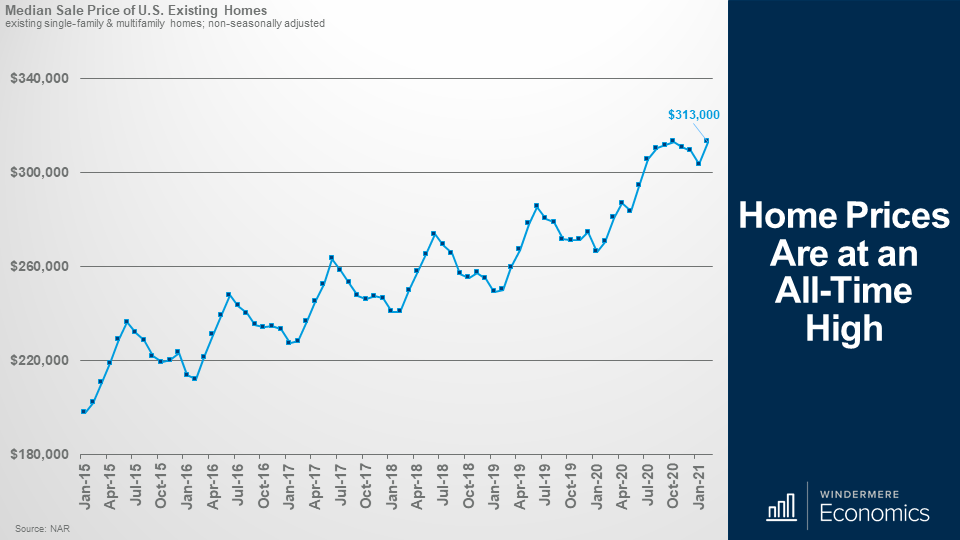
Home Prices are at an All-Time High
And looking at sale prices, they ticked higher in February to a median of $313,000, and that matches the all-time high seen last October and is 15.8% higher than we saw a year ago. This is the fastest annual pace of price growth seen since August of 2005, but I have to add that the number is a little deceiving as it was skewed higher by significant growth at the upper end of the market with sales above $750,000 accounting for close to 10% of all sales in February and sales above $1M up by a whopping 81% when compared to a year ago.
The numbers also showed that homes took an average of just 20 days to turn pending, another record, and 74% of homes sold in less than one month.
Individual investors or second-home buyers purchased 17% of all homes sold in February, and that’s up from 15% in January and matches the share seen a year ago
Now, as we move through the year, there are a couple of things worth noting.
We all know that the market is tight, but I still expect total sales this year to come in at around 6.3 million units – this is lower than my forecast from the start of the year but would still represent an 11.6% increase over 2020.
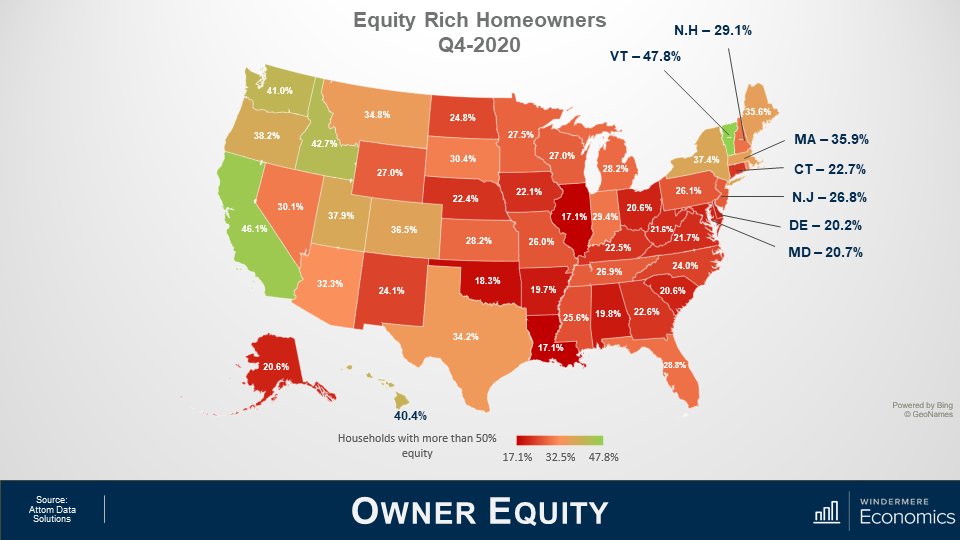
Owner Equity.
Although these are not numbers from NAR, I did want to share with you some different data that does relate directly to the increase in sale prices that we have just discussed.
With the significant upswing in sale prices that we have seen over the past 8 or so years, over 30% of all homeowners in America currently have more than 50% equity in their homes and this is a massive figure.
But across the country, there are significant variances as you can see here.
The largest share of homeowners who are equity rich live in Vermont and California but many west coast markets are not far behind with significant owner equity seen in WA, OR, ID, UT, & CO.
These really are very impressive numbers.
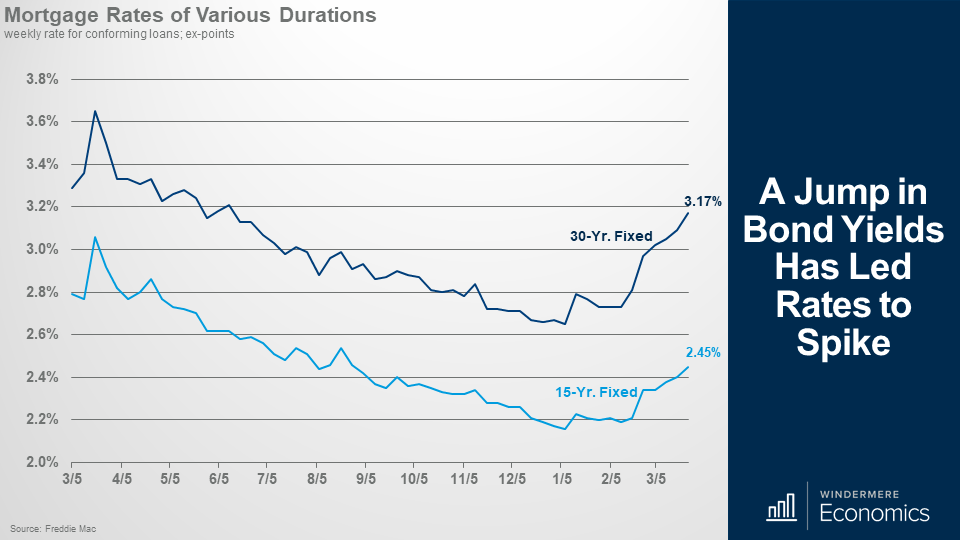
A Jump In Bond Yields Has Led to Rates to Spike
It’s time to take a look at mortgage rates as a lot has been going on in that space too since we last talked.
This chart shows the average weekly rate for 15 and 30-year conforming mortgages and, as you can see, rates started to jump in early February and I find it very unlikely that they will drop back down at any time soon.
I am sorry, folks, but the days of 30-year rates starting with a 2 handle well they are now firmly in the rearview mirror.
So what has caused this spike?
Well, it’s very simple. COVID-19 case counts are dropping; the distribution of a vaccine is going remarkably well. As I speak, over 130 million doses have been given and over 46.4 million people are now fully vaccinated against COVID-19.
But there is a fear that that – with the country starting to reopen – we will see a significant boost in economic activity which, in concert with the latest round of stimulus payments, has generated rumblings from some economists who are now looking to see inflation to take off.
And as much as its great news that we are seeing a better than expected rollout of the vaccine, which will lead to faster economic growth in the second half of the year, the potential for inflation to rise is now elevated and this has caused a move out of bonds – specifically 10-year treasuries, which means that the interest rate for these bonds has to rise and the interest rate on 10-year paper directly impacts mortgage rates – specifically the rate on the ever-popular 30-year mortgage.
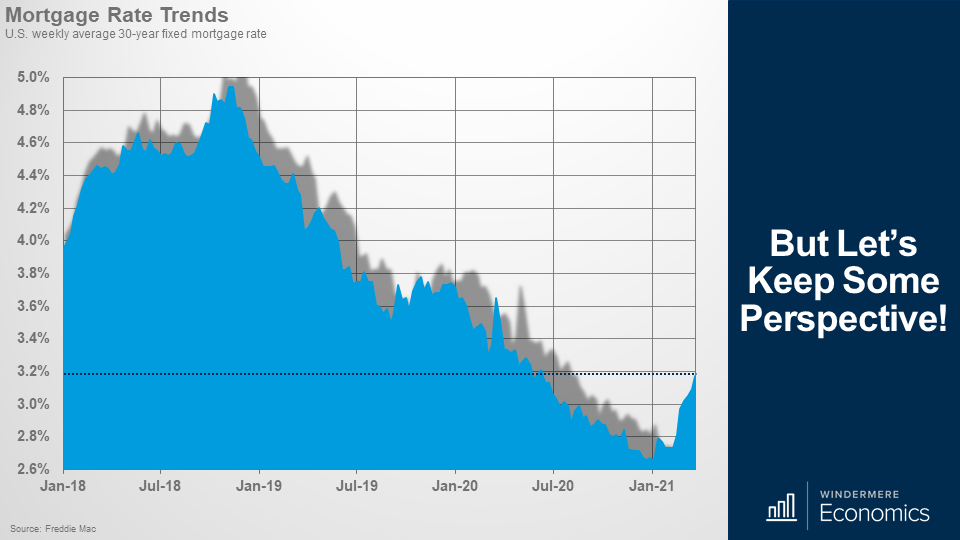
But before everyone starts getting panicked about this, look at it this way.
But Let’s Keep Some Perspective!
Even at 3.17%, rates remain remarkably low. Yes, the current rate was last seen in June of 2020, but it is still well below the long-term average.
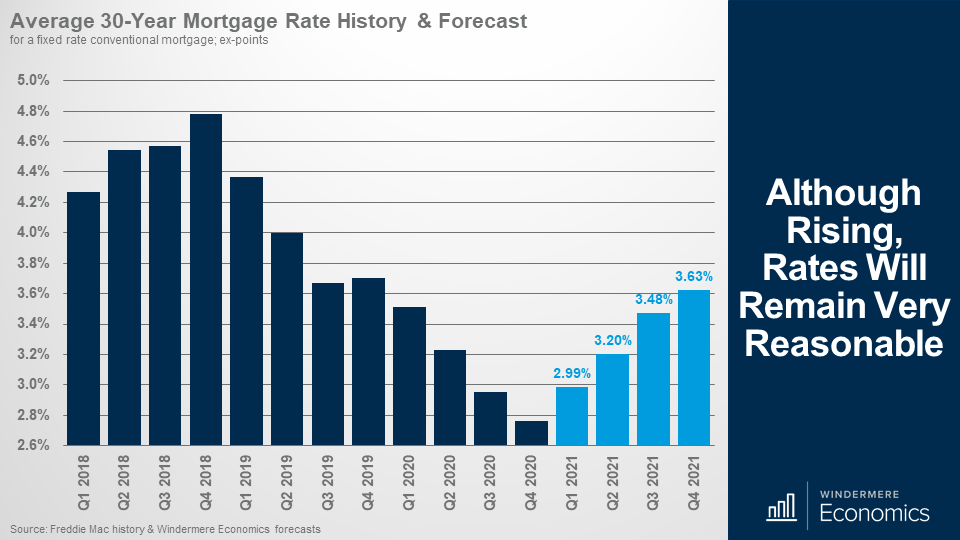
But, that said, and given the upward move in Treasury yields, I have had to rerun my forecast models for mortgage rates, and here is where I see rates trending this year.
Although rising, rates will remain very reasonable
I expect that we will see rates rise to an average of 3.6% by the 4th quarter of 2021 and, looking farther out, we will likely break back above 4% in early to mid-2022.
Now, I could actually be a little optimistic if – and it’s a big if – 10-year bond yields rise faster than I am forecasting but, for now, I don’t see that happening unless, of course, inflation really does take off but, again, I don’t see that.
That said, I am looking for a spike in inflation in the next few months as we feel more comfortable going out again and we start to spend our money in a more normal manner, but I believe that inflation will level off and not get out of control. However, if it does, then more bond buyers will head further out along the yield curve and buy longer duration treasuries to counter inflation, which will mean that the interest rates on 10-year treasuries will have to rise to attract buyers and this, of course, will lead mortgage rates higher.
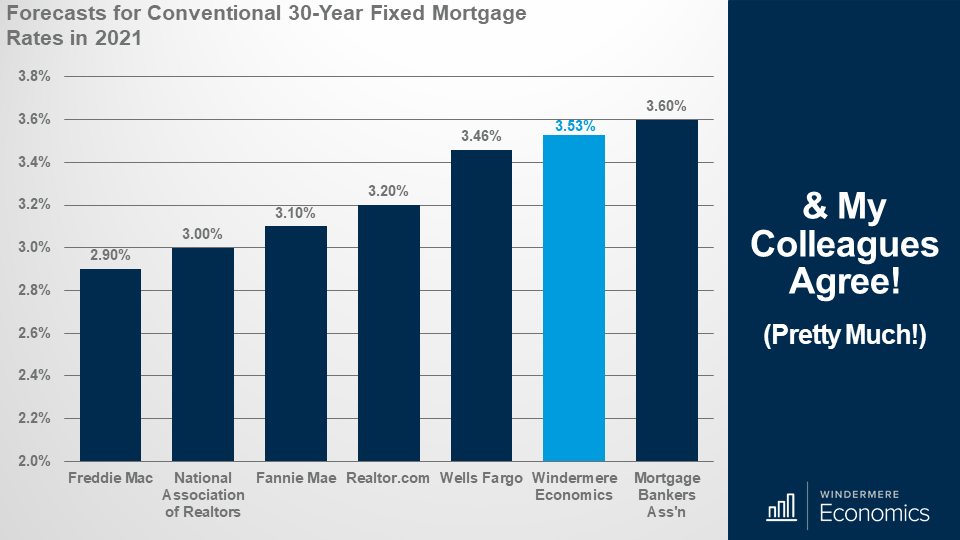
And my colleagues agree!
And just in case you don’t believe me, here is my forecast for the average rate in 2021 rates alongside some of my fellow economists, and, as you can see, other than Freddie Mac, we are in a fairly tight range.
I would add that the NAR and Freddie forecasts are a month or so old, so I would not be surprised to see them revise their forecast upward at some point.
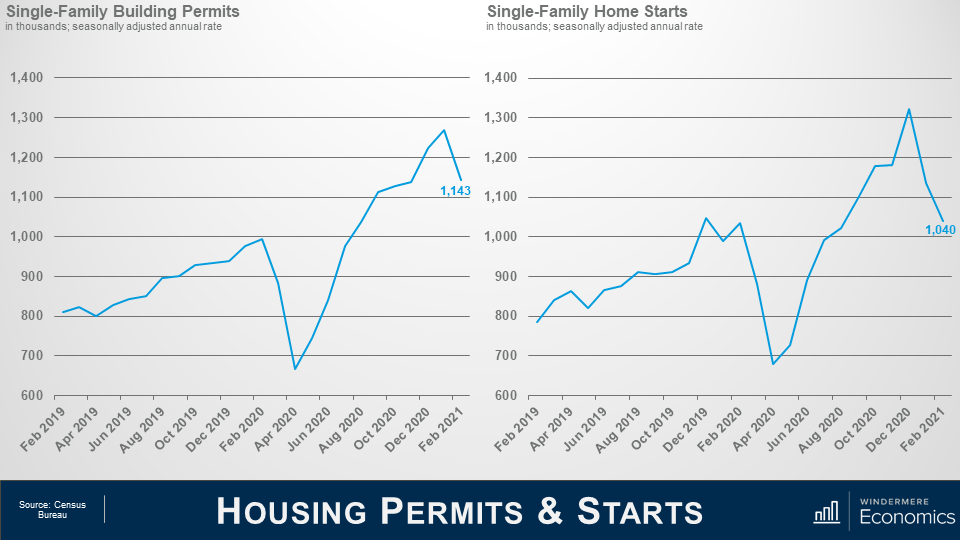
Housing Permits & Starts
Moving on to the new home market – both permits and starts pulled back in February with starts down by 8.5% on the month and single-family permits down by 10%.
So, what was going on? Well, despite strength in buyer traffic and lack of existing inventory, builders are slowing some production of single-family homes as lumber and other material costs continue to rise.
And shortages of lumber and other building materials, including appliances, are also putting future construction at risk.
While single-family starts for the first two months of the year are 6.4% higher than the first two months of 2020, there has been a 36% year-over-year increase in single-family homes permitted but not yet started as some projects have been put on pause because of the cost and availability of materials to build homes.
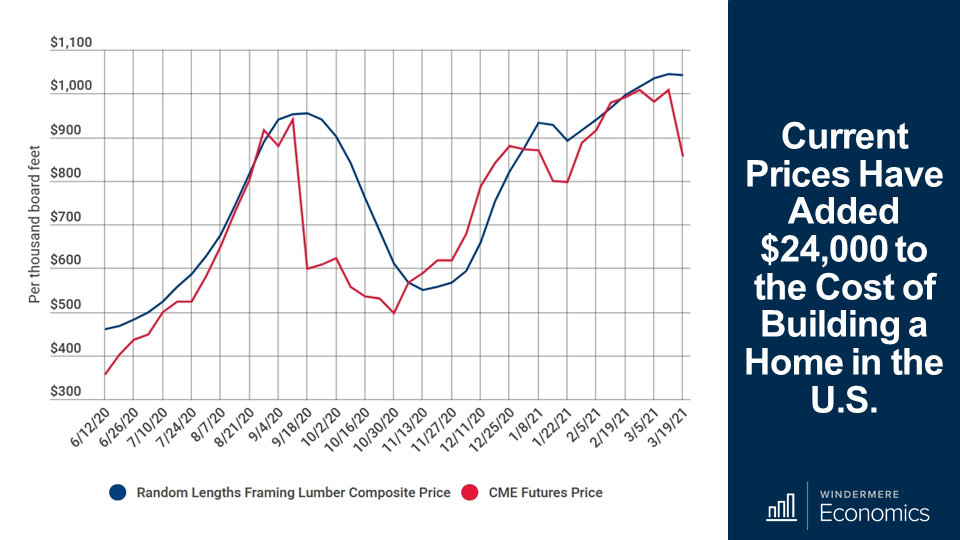
Current prices have added $24,000 to the cost of building a home in the U.S.
And to give you some perspective about the direction of lumber prices, they have skyrocketed more than 180% since last spring and this price spike has caused the price of an average new single-family home to increase by more than $24,000 since April of last year.
This chart provides an overview of the U.S. framing lumber pricing market and it’s not pretty.
But you can also see that the futures price has been dropping which may mean that we are getting closer to the end of the massive increases in lumber prices that builders have been facing. Time will tell.
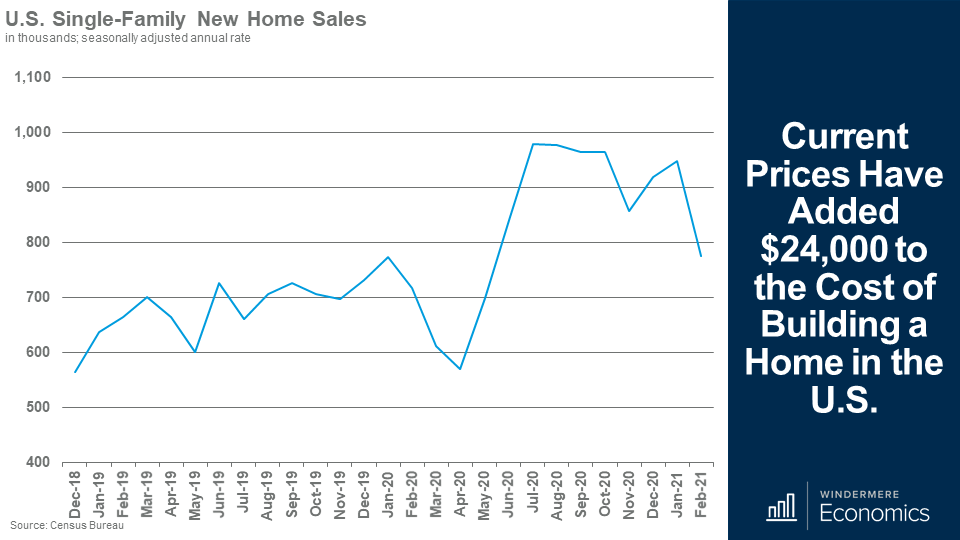
U.S. Single-Family New Home Sales in thousands, seasonally adjusted annual rate.
And on the sales side of the equation, after a slight rebound in December and January, the slowing of the pace of new home sales continued in February as a combination of affordability challenges, more costly materials, and storm effects which, in concert with each other led purchases of new homes to drop by 18% to a seasonally adjusted annual rate of 775,000 units.
But I would add that the February sales rate was 8% higher than we saw a year ago, and there is still demand which is being supported by still relatively low-interest rates, but more from solid demand in lower-density markets like the suburbs and exurbs.
Inventory levels did rise slightly with 312,000 new homes for sale, but that was 4.6% lower than a year ago.
The median sales price came in at $349,400, up 5.3% from a year ago.
And finally, I recently read a fascinating analysis that the NAHB put out which in essence, suggested that the recent rise in mortgage interest rates over the past two months has priced more than 1.3 million households out of the market for a median-priced new home.
In fact, the study found that just a $1,000 increase in the U.S. median new home price would push 153,967 households out of the market.
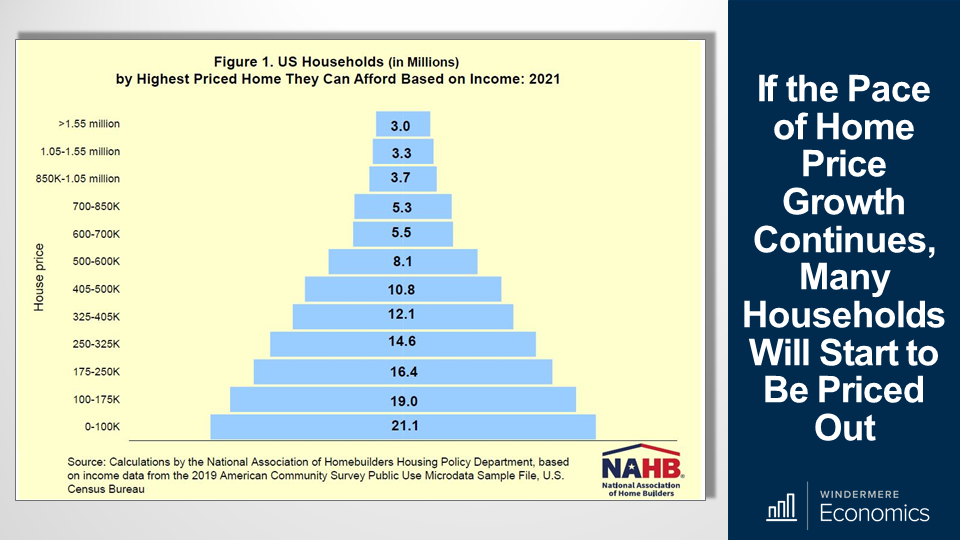
If the Pace of Home Price Growth Continues, Many Households Will Start to Be Priced Out
So, looking at it this way, the NAHB created the affordability pyramid you see here which shows that as the price of a new home increases, the number of households in each tier that are able to afford it decreases. All very logical.
About 21.1 million households are estimated to have the income needed to buy homes priced below $100,000 and they are shown on the bottom step of the pyramid.
And of the remaining 101.8 million households who can afford a home priced at $100,000, 19 million can only afford to pay a top price of somewhere between $100,000 and $175,000 and they are shown on the next step and, naturally, this trend continues up the pyramid of house prices with each step representing a maximum affordable price range and the number of households who qualify.
Although it’s certainly possible to find households at the high end of the market, there are a lot more households at the low end where affordability is a very major concern – 71.1 million households in America could not afford to buy a median-priced new home. That’s almost 58% of all households in the country.
The bottom line is that increased development costs can, and likely will, price these households out of the market for a new home, and with the cost of existing homes also rising rapidly, for more and more households, reaching the American dream of homeownership is getting harder and harder.
I am sorry – I really didn’t mean to end on a low note – but the facts are the facts. We need more housing supply and we need home price growth to slow. Of course, price growth will slow if my mortgage rate forecasts are accurate but it might already be too late of many who would like to buy a home.
So, there you have it. My take on the January housing-related data releases.
As always, if you have any questions or comments about the numbers we have looked at today, feel free to reach out. I would love to hear from you.
In the meantime, thank you for watching, stay safe out there, and I look forward to visiting with you again, next month.
Hello there and welcome to February’s edition of Mondays with Matthew.
Well, there were a lot of housing-related data releases in the month that are worthy of discussion so let’s get straight to it. I am going to start out with the latest homeownership data that was just released by the Census Bureau.
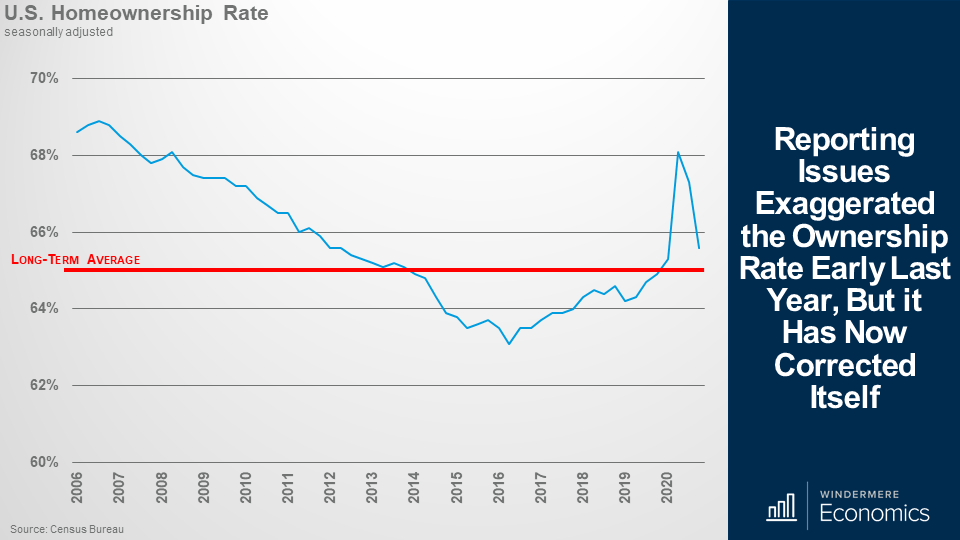
Those of you who regularly watch my videos may remember that last year I suggested that the data may have been a little bit suspect – specifically when it came to the second and third quarter ownership rates.
Anyway, for those that didn’t see me address this, or if you have forgotten, I had a concern about the significant spike in the ownership rate that you can see here, and I suggested that it might be suspect because of the way the data was gathered during the early days of COVID. You see, the survey was done via telephone and not in person – as it usually is – because of COVID-19 restrictions and I believe that this actually led to an overreporting of the real ownership rate.
Following the massive spike we saw in the second quarter, it appears that they have found a way to more accurately gather the data and the rate has now pulled back to a level that, at least for me, passes my “sniff test”! However, even though the share of US households who own their homes did drop, it still remains above the long-term average and stands at a level we haven’t seen since 2012.
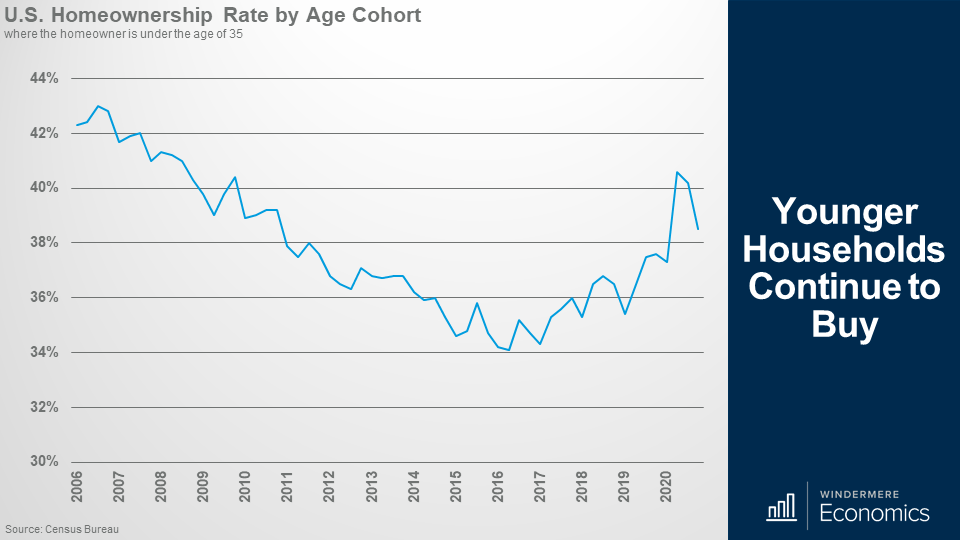
Younger Households Continue to Buy
And when we drill down into the data and look at the ownership rate for Millennials – I know, I harp on about them a lot – but you can clearly see that they really are becoming homeowners in increasing numbers and the current rate of 38.5% is a share not seen since 2011 and I expect to see this number grow over the next several years.
Demographics are driving them into homeownership as they are all getting older, many now starting families and they want to own a home. I would also add that I would not be surprised to see them shift toward ownership at even faster rates if they are allowed to work from home which may lead more of them to leave expensive cities and move to markets where it’s more affordable to buy.
And to give you a different perspective on these younger buyers, last week the New York Fed released their report on household debt that included numbers regarding the share of mortgage borrowing by age. Well, you can see in the above graph, that younger buyers continue to account for a major share of total mortgage borrowing and are borrowing pretty substantial amounts too.
In fact, in 2020 Millennial and Gen Z households borrowed over $1.3 trillion to buy homes and that’s over 35% of total new mortgage debt on a dollar basis. Although I think it’s great to see younger households grow as homeowners and the overall homeownership rate rising, all is not as I would like to see it – especially when we break down the homeownership rate by ethnicity.
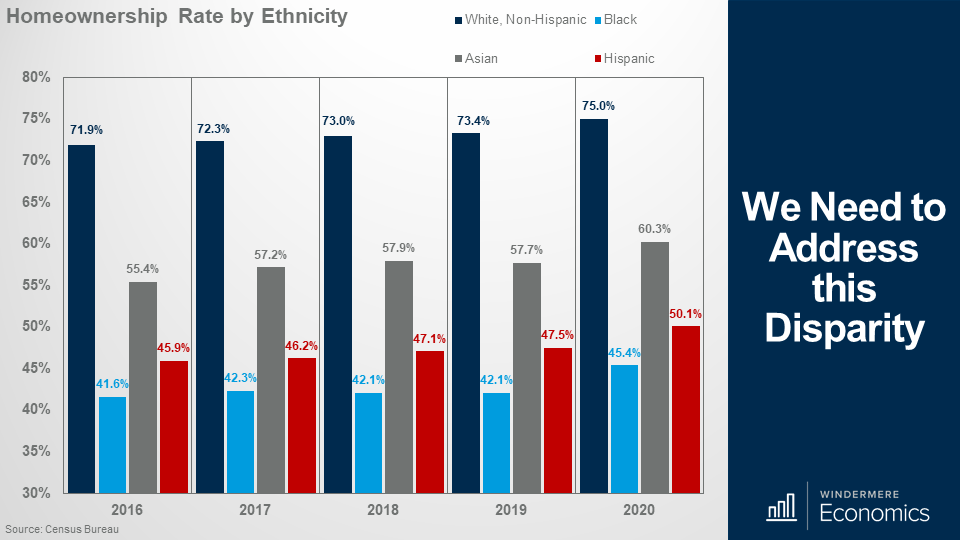
And the above report, again from the Census Bureau, showed that although the share of white households who own their homes ticked up it also showed some significant disparities with the ownership rate for black households – although up a little – still well below the levels seen with other ethnicities.
This is a long-term, and systemic issue, that needs to be addressed.
The bottom line is that the ownership rate for Black families was 25 percentage points lower than that for white families in 2020 and was even higher in the 4th quarter of the year when it almost hit 30%.
I am pleased that the Biden administration does have plans to try to address this inequality by looking to expand the ability of the Federal Housing Authority to provide mortgages and this might, if it gets approved, start to address this very significant issue. Of course, nothing will be fixed immediately, but it is a major concern and sincerely hope that, over time, this discrepancy will be addressed.
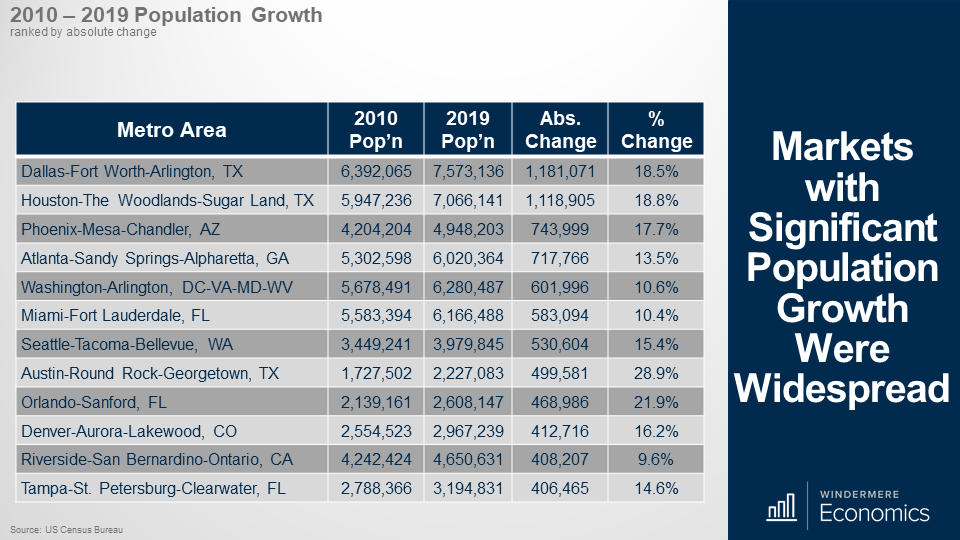
We had a very significant data drop – again from the Census Bureau – who provided their population estimates for 2019. The data may be old, but it is interesting all the same. This table shows the markets with the greatest increase in population between 2010 and 2019.
I will be honest with you that I was not surprised to see Texas lead the way, but it was interesting to see the greater Seattle region, Denver, and Riverside, California all make it close to the top of the list.
And because a couple of markets that were close to the top of the list are of interest to Windermere (as we have offices in these areas) I thought that it would be interesting to look at how some of the other markets where we have a presence are doing and the numbers are equally as impressive.
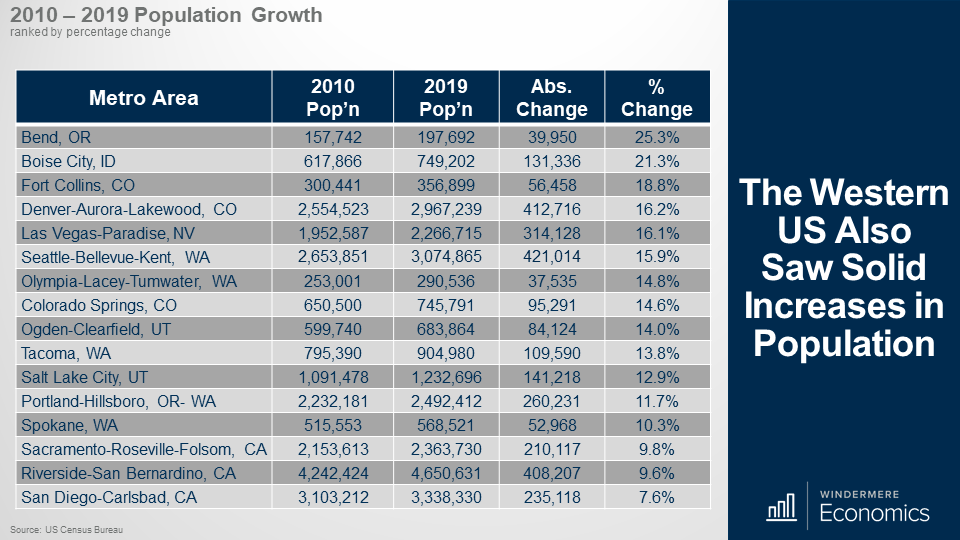
Of course, markets are of different sizes, so to balance this out, the data here shows growth in percentage terms and the numbers are again very impressive.
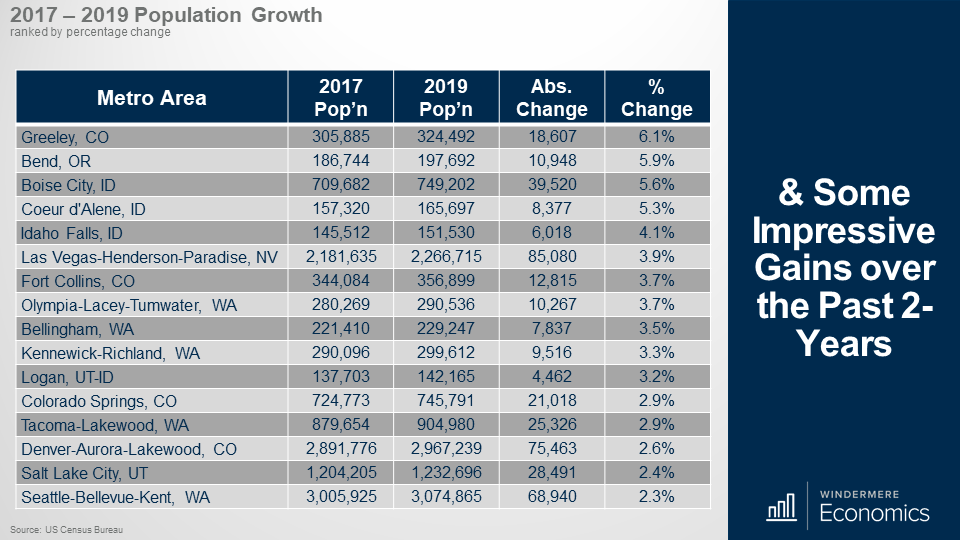
And when I focused on 2-year growth, well it’s again very impressive with significant increases seen in Colorado, several Idaho markets, Las Vegas, Western Washington, and Utah.
And I would also add that Greeley was number one here, but also ranked 4th nationally. Bend came in 7th, Boise 9th, and Coeur d’Alene 10th. Yes, I know that this data is old – it’s an issue I fight with every day – but I still see it as being meaningful.
Of course, I will be very interested to see the 2020 numbers as they will give us an indication as to how COVID-19 really is impacting where we choose to live, but we will have to wait for that!
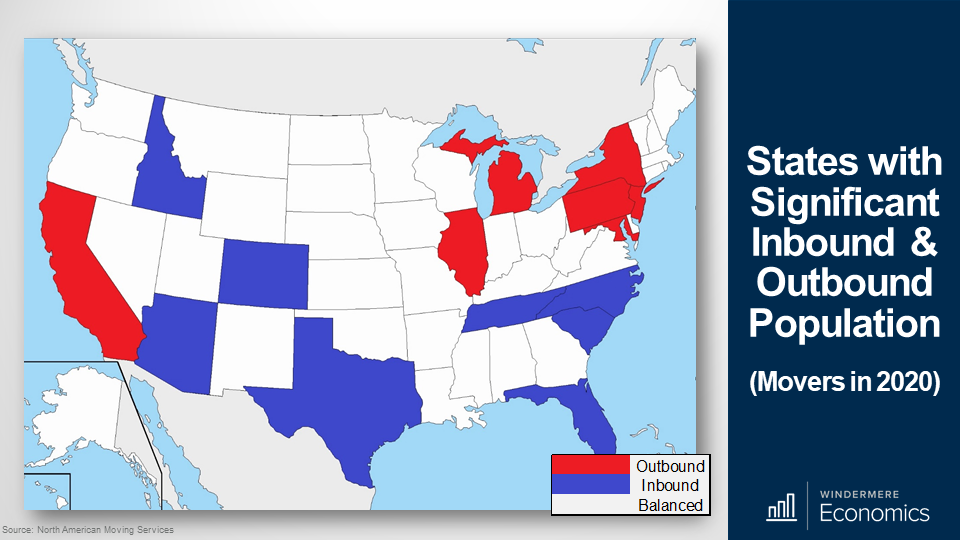
I did read a very interesting report that was recently published by North American Moving Services where they looked at where households who moved between states moved to last year. Of course, it is not a perfect analysis, but it does give us an idea as to not just where people moved to, but where they moved from, in 2020.
Unsurprisingly, the largest out-migration states included California – where people were mainly moving to Texas and Idaho – but there was also significant out-migration from Illinois, New York, and New Jersey.
As far as where most people migrated to, in addition to Idaho, movers were also attracted to Arizona, Colorado, Tennessee, and North and South Carolina.
Interestingly, Northeastern states make up four out of the seven states with the most outbound moves, and none of them make the top eight for inbound moves. Number one was New York which saw significant out-migration. Number 2 was New Jersey and Maryland was just beaten into 4th place by California.
But as far as the western US is concerned, – other than California – people are consistently moving in, and not out.
Also supported by the census numbers we just discussed, the number of households relocating to Idaho has been significant for the past five years and I would add that Colorado has also been in the top-10, or very close to it for the past five years.
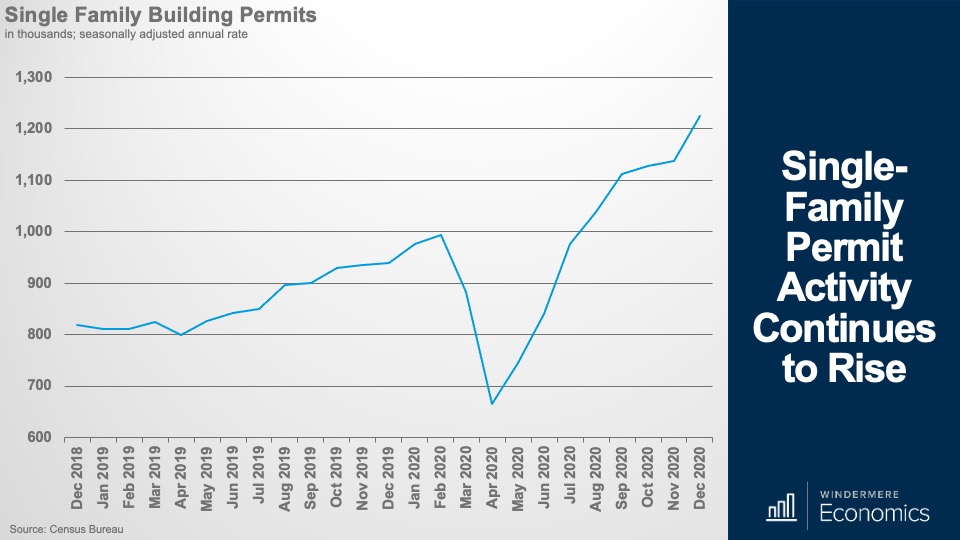
Last week we saw the latest data on building permits and starts and although there was a softening in the number of starts in January, permit activity continues to grow significantly with single-family permits up by a massive 3.8% month over month, and 30% higher than seen a year ago. This is good news!
As far as the weakness of starts is concerned, this was primarily due to some builders who remain worried about increasing lumber and other construction material costs, as well as concerns over delays in obtaining building materials because of COVID-19 supply chain issues.
I would add that although single-family starts did drop, the number of homes under construction continued to trend higher. And for those of you who might be wondering how new starts can drop but the number of homes being built can increase, it’s purely terminology. You see, a housing “start” is where a foundation has been poured, but it doesn’t mean that vertical construction has started.
In fact, the number of homes under construction in January was up by 1.1% on the month and is over 16% higher than seen a year ago.
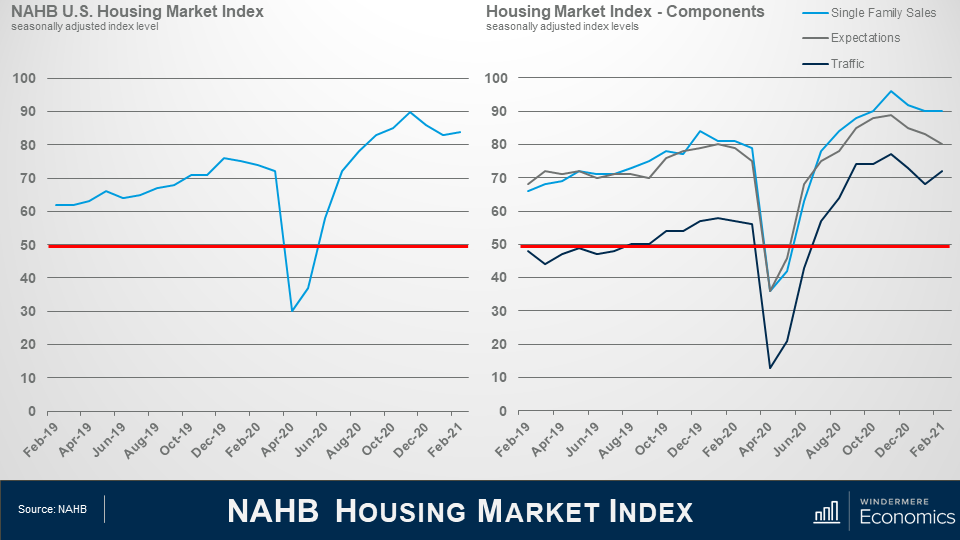
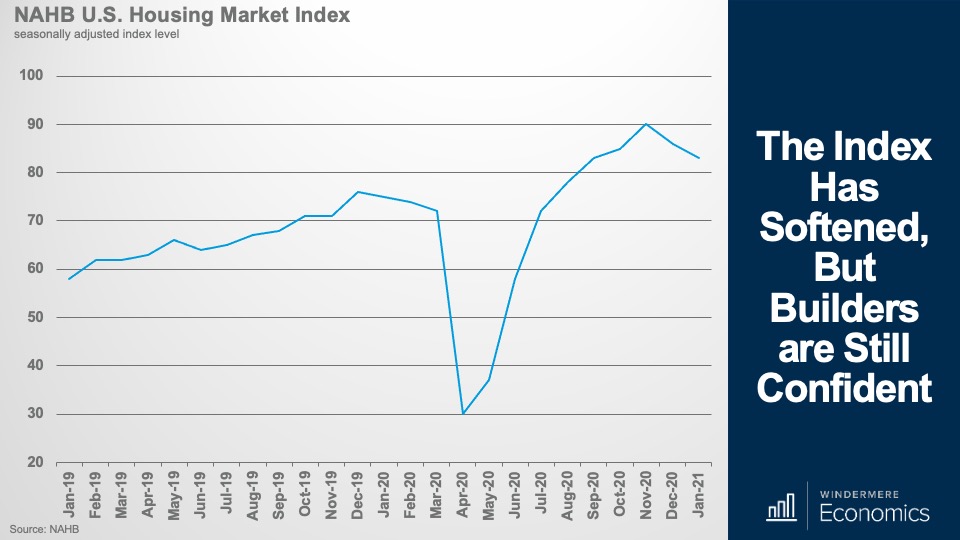
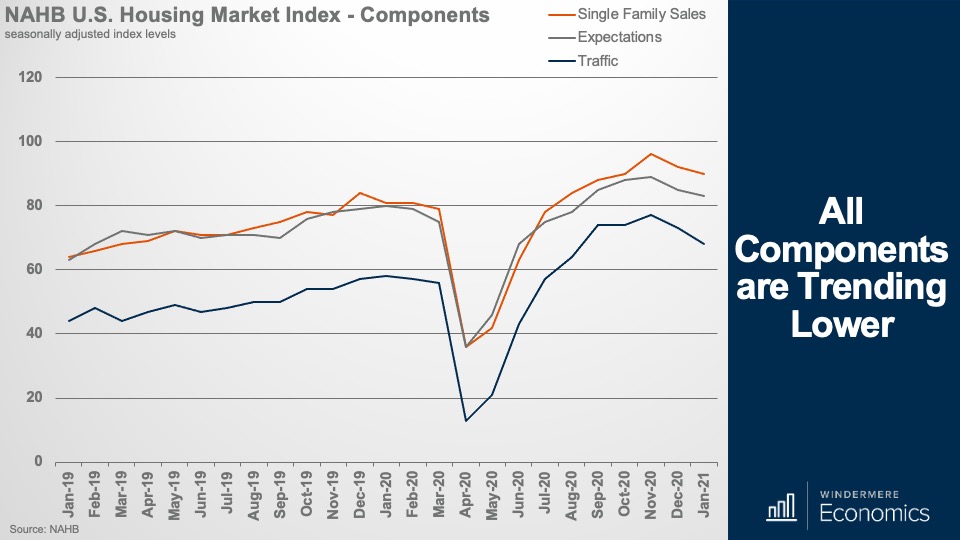
Last week we also got the February take on builder confidence and it was interesting to see it ticking back up as strong buyer demand helped to offset the supply chain challenges and surging lumber prices.
On the right, you will see the three components of the index which showed the gauge of current sales conditions holding steady at 90, while the component measuring sales expectations in the next six months fell three points to 80 but the gauge charting traffic of prospective buyers rising by four points to 72.
Although all are off their peak that was seen last fall, all are above 50 meaning that more builders find the market favorable than not.
So, this was a pretty mixed bag, but the Market Index numbers are more current than the permit and starts report so I will be interested to see what the February housing starts looks like – it wouldn’t surprise me to see a slight uptick in the number.
And finally, the January US housing sales numbers were released by the National Association of Realtors and, well, they were – again – record breaking!
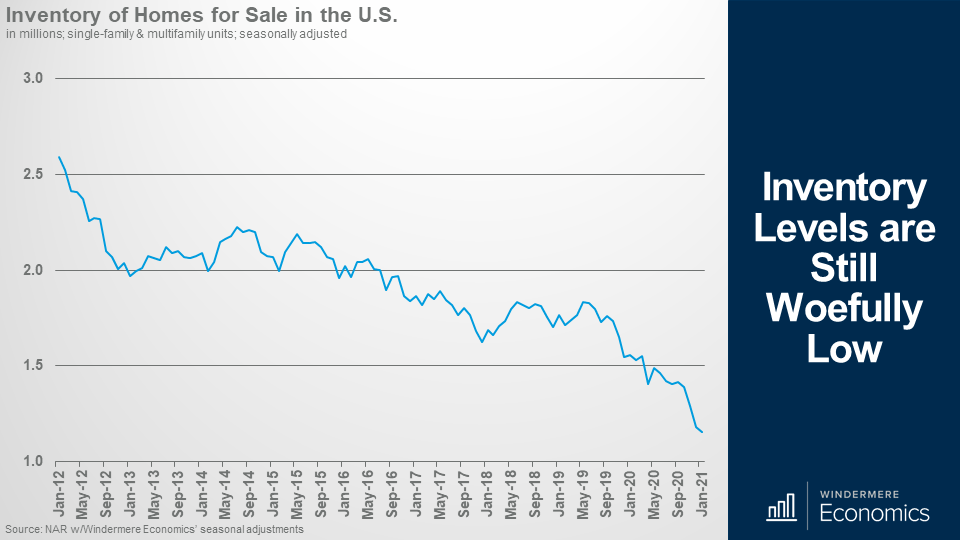
Inventory levels are still woefully low.
On the supply side, any hopes that we might have seen the number of listings rise in January were dashed with total inventory coming in at a measly 1.04 million homes for sale – that’s down 25.7% year-over-year and a new record low in absolute terms, but also a record percentage drop between January of 2020 and January of 2021.
Breaking it down, the number of single-family homes on the market remained static at 880,000 units, but the number of condominium listings dropped a little to 164,000 listings – that’s down from 179,000 in December.
Given the very low number of listings – and sales still very robust – there was just 1.9-months of supply – matching the all-time low we saw in December.
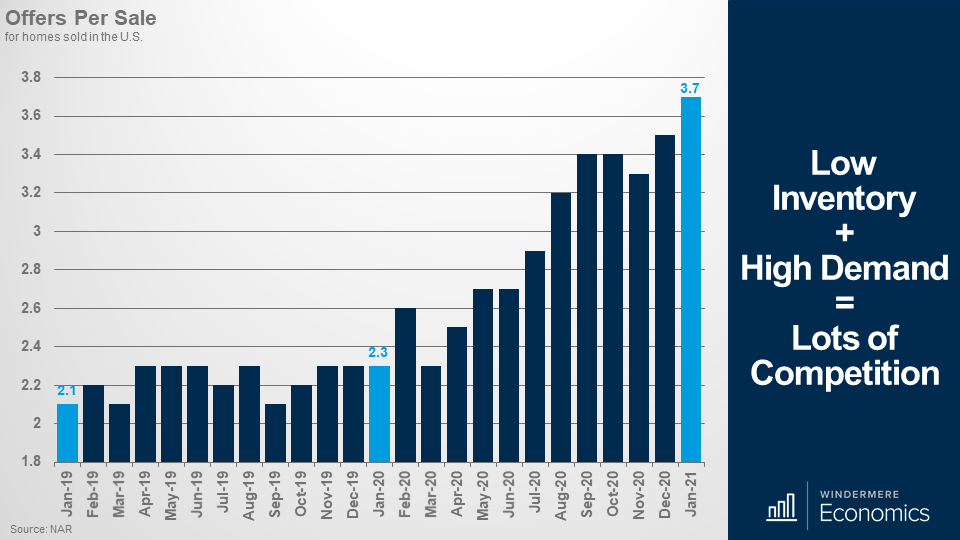
I always find this data set fascinating – and another record has been broken. For every sale that was agreed in January there were an average of 3.7 offers! That’s a massive increase from the old record of 3.5 set just the month before.
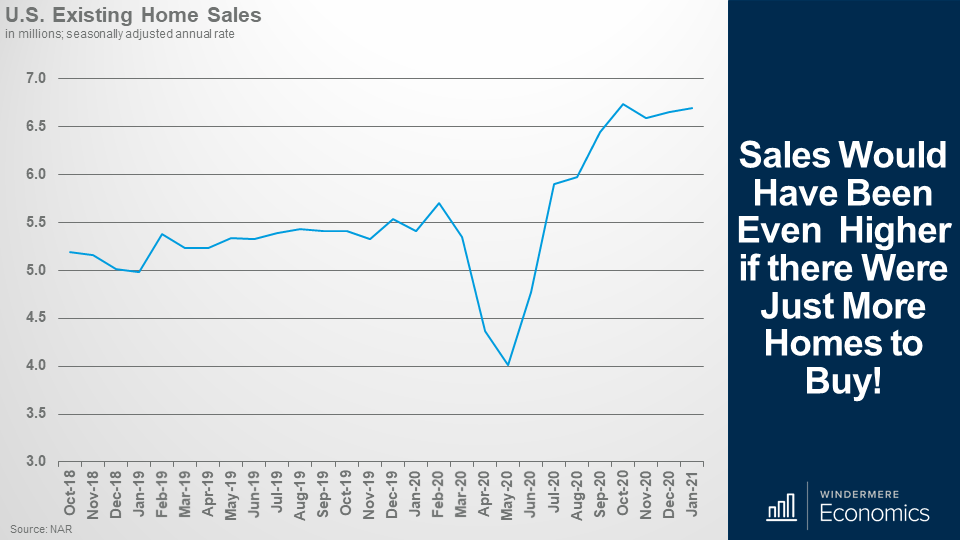
But even with record-low inventory, the number of sales remains very impressive.
Sales would have been even higher if there were just more homes to buy!
Total sales of single-family and multifamily units came in at an annual rate of 6.69 million units in January. That is 0.6% higher than seen in December, and up by a massive 23.7% from a year ago. Sales of single-family homes rose by 23% to an annual rate of 5.93 million units while sales of condos rose by 28.8% to an annual rate of 760,000 units.
Now, some of you may be wondering how this can be? How can sales rise when there are so few homes for sale? And that is a very reasonable question.
You see, the number of homes for sale is the total available on the last day of the month, but sales can still increase because if a home is listed for sale and goes under contract in the same month, well it isn’t included in the inventory numbers for that month.
And in January, properties averaged just 21 days on the market with 71% of them selling within the month.
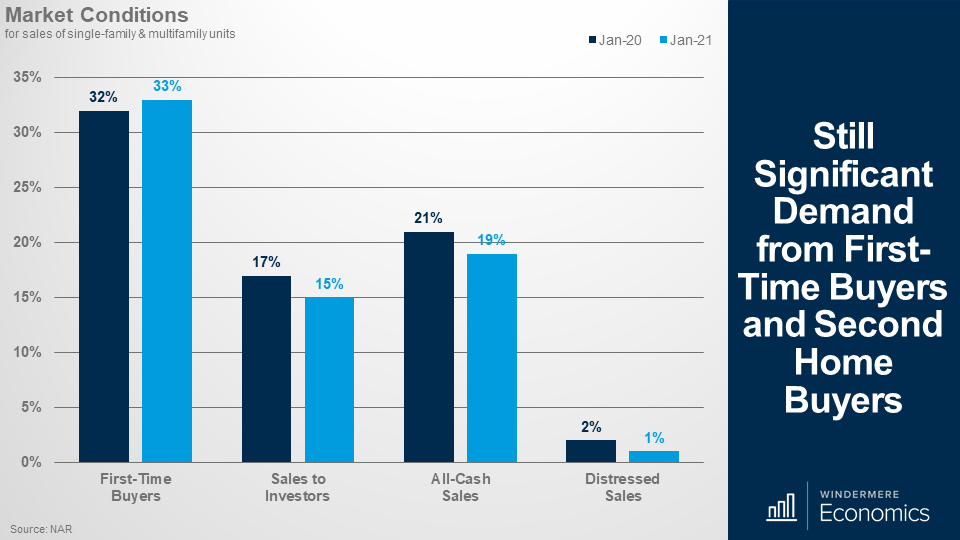
Still significant demand from first-time buyers and second home buyers.
And when we look at the details it was pleasing to see the share of homes that sold to first-time buyers up a little. Sales to investors – and these numbers include many second-home buyers – pulled back a little, but again, not a concern.
And finally, no surprises here – with many homes in forbearance, the share of distressed sales was just 1 percent.
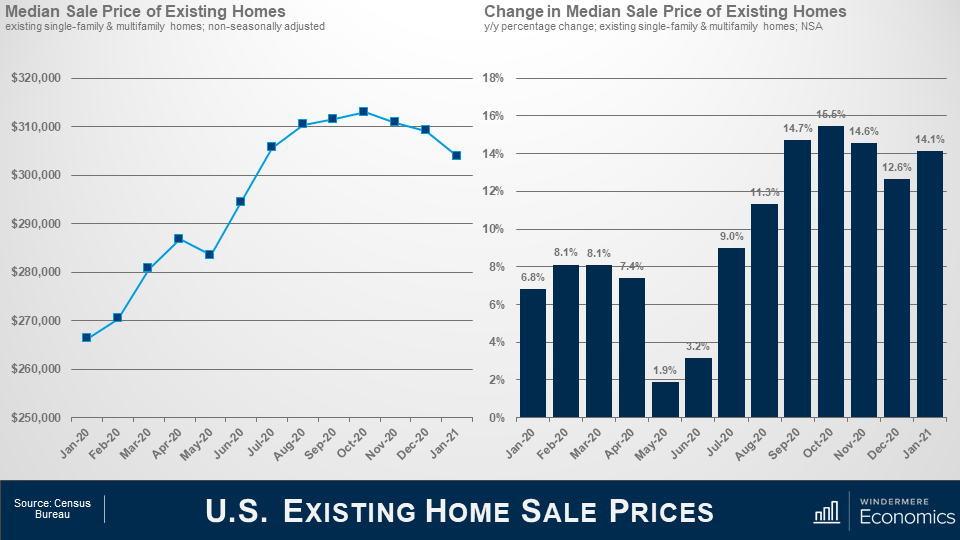
The median sale price in January was $303,900 and that’s up by 14.1% year-over-year. Now, before you get worried about the fact that it appears that prices have plateaued, it’s actually not surprising as it’s mainly a function of seasonality, as well as the limited choice of homes to buy.
Sales of homes in the US priced below $100,000 were down 28% year over year, while sales of homes priced between $500,000 and $750,000 were up 53% year over year, and sales of million-dollar-plus homes were up by 76.7% from a year ago. Geographically, price growth was most robust in the west where they were up by 16.1% year over year. Also, $1 million-plus sales accounted for over 11% of all sales in the western US too.
As I worked through the January numbers, it remains very clear to me that housing remains a shining light as we move through this pandemic period, and I expect this to continue with 2021 being another very good year for the housing market, and home sales rising even more as a vaccine gets more broadly distributed and we reopen more of the country.
So, there you have it. My take on the January housing-related data releases.
Hello there and welcome to the first Mondays with Matthew for 2021. It’s great to be back and I hope that you all had a fantastic holiday season and are getting into the new year groove.
Well, there’s a lot of data releases to talk about today so let’s get to it. First up is the latest National Association of Homebuilders report on builder confidence.
The index slipped to 83 from 86 but, for context, any reading above 50 means more builders view market conditions as favorable than poor.
Now, as you can see, following a very impressive recovery following the start of the pandemic, U.S. homebuilder confidence has trended lower for the past 2-months but, to tell you the truth, I really wasn’t surprised to see this.
Why wasn’t I surprised?
Well, its actually rather simple. Surging COVID-19 infections in concert with increasing material costs offset record low mortgage rates.
Builders are still grappling with supply-side constraints related to not just material costs, but a lack of affordable lots on which to build, and labor shortages that are all putting upward pressure on new home prices.
It’s very frustrating for builders these days as they see very significant demand for housing – driven by cheaper mortgages as well as an exodus from city centers to the suburbs and other low-density areas as companies allow employees to work from home because of the pandemic.
Oh! Talking of work-from-home, I did see a number put out by the Census Bureau in their Household Pulse Survey that suggested that about 38% of the labor force is now working at least part-time from home. That’s a massive number.
Anyway, all of the component parts of the survey trended lower with the measure of sales expectations in the next six months falling two points to 83, the gauge of current sales conditions also dropping two points to 90, and the prospective buyers index falling by five points to 68.
I am not worried by this as, even at these levels, builders are still pretty bullish about the market, and I say this because of the next dataset I’m going to talk about – the housing permit and starts report.
Even if builders were suffering from worries regarding costs. Oh! I should add that their biggest issue as far as material costs are concerned are that lumber prices have risen by 52% versus a year ago! Anyway, this increase in cost, as well as the other issues that we have just talked about didn’t translate into slowing activity when it came to permits and starts which both surged in December.
This chart shows the number of single-family permits issued across the country and the figure rose by 7.8% between November and December to an annual rate of 1.226 million units. That’s 30.4% higher than seen a year ago. And the fastest rate seen since 2007.
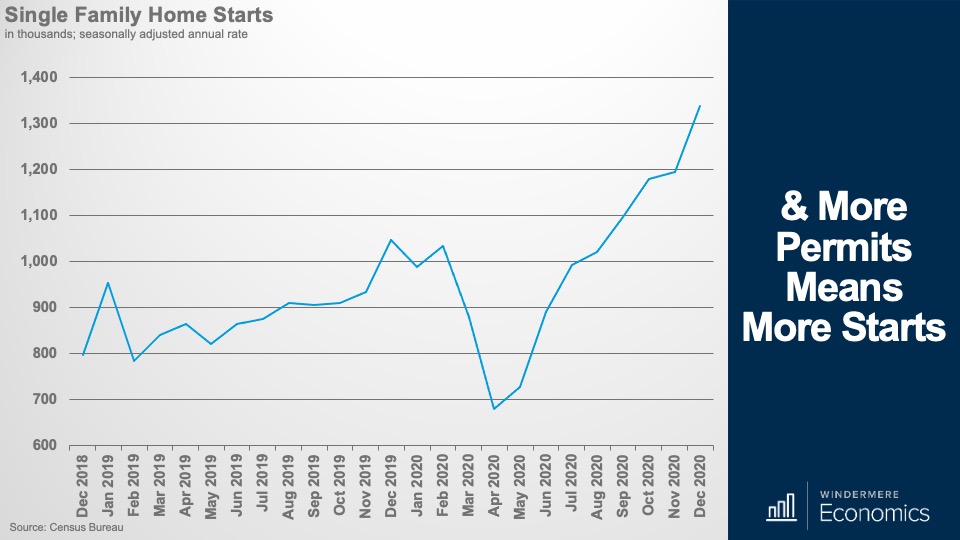
And looking now at housing starts, well they impressed too with a 12% month over month gain to an annual rate of 1.338 million units – and that’s 27.8% higher than a year ago.
I would also note that single-family starts have increased for eight straight months now. And – given the data that we have just looked at – it’s not surprising to see a very significant jump in the number of homes under construction.
Now, in case you are a little confused by terminology, I should let you know that housing starts don’t actually relate to the number of homes being built. Starts refer to lots where a foundation has been poured, but it doesn’t mean that vertical construction has commenced. For that we need to look at the under-construction data shown here.
And the number is pleasing. In fact, the current level of ground-up construction is at its highest level since 2007.
The bottom line is that I expect to see the number of starts and homes under construction continue to rise, and new supply of homes is likely to take some of the upward price pressures off the resale market.
In fact, my current forecast is for new home sales to rise this year to about 988,000 units.
And talking of the resale market, I know that you have all been waiting for the December existing home sales numbers and they were released last Friday.
Before we get to the good stuff, I want to start with inventory – or lack of it!
Without seasonal adjustment, the number of homes for sale in December stood at just 1.07 million homes – and that’s down 23% year over year.
For perspective, that is the lowest number of homes on record and, at the current sales place, that represents a 1.9-month supply and that’s the lowest number seen since the National Association of Realtors began tracking this metric back in 1982.
So – we know that there is nothing to buy, but what’s happening to sales?
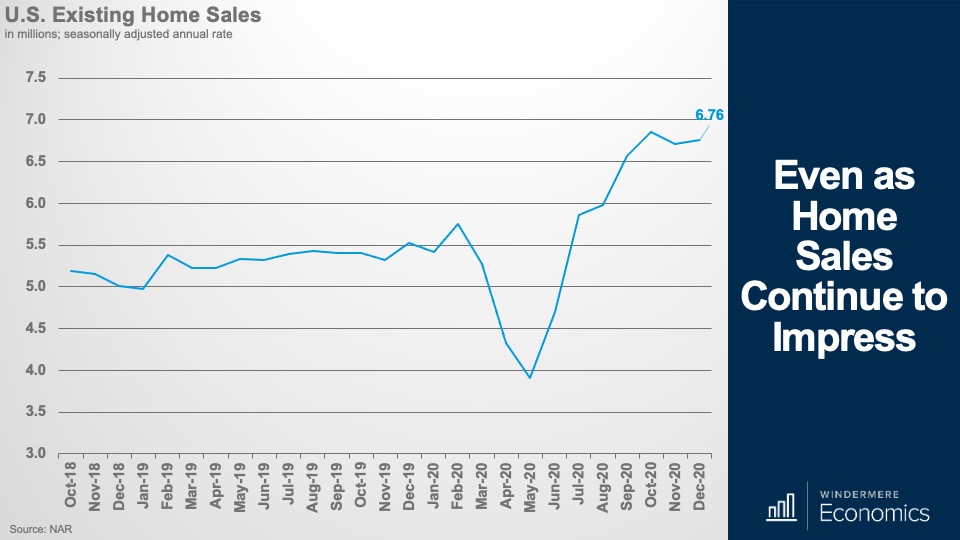
Look at this! Pandemic-driven demand for housing sent total 2020 home sales to the highest level since 2006.
Closed sales of existing homes in December increased just 0.7% from November to a seasonally adjusted annualized rate of 6.76 million units and sales were 22% higher than seen in December of 2019.
As unexpected as a global pandemic was, so too was the reaction of homebuyers. After plummeting in March and April, sales suddenly began to climb.
Total year-end sales volume ended at 5.64 million units, and that was a number far higher than I – or anyone – was predicting before the pandemic started.
COVID-19 drove buyers desire for larger, suburban homes with dedicated spaces not just for working but for schooling as well.
And I will tell you that, in my opinion, sales could have been even higher if there were just more homes to buy! I wouldn’t have been surprised, again, if we had no inventory constraints – to have seen over 7 million sales occurring last year and that would have matched the all-time high seen in 2005.
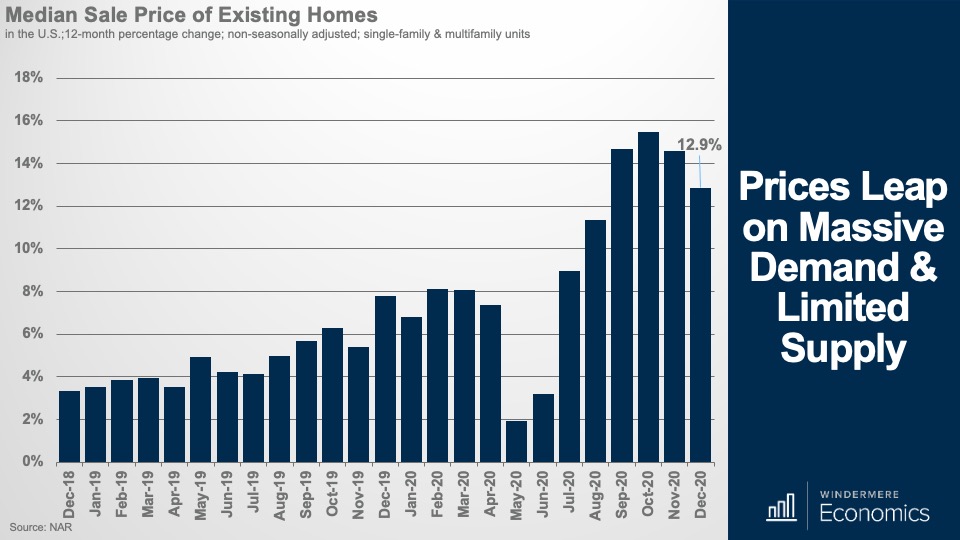
But of course, there is a price to pay when you have so much demand, and so little supply.
That’s right. Prices go up!
Low supply and very strong demand continued to heat home prices with the median price of an existing home sold in December coming in at $309,800, that’s a 12.9% increase when compared with December 2019 and the highest December median price on record. I would also add that this price is only marginally below the all-time high that was seen last October.
The surge in prices really has been quite remarkable, but I am not too surprised. Yes, demand has risen significantly, and supply has not, but much of the growth was driven by mortgage rates that have dropped precipitously since the pandemic started and are over a full percentage point lower now than they were a year ago.
I would add that part of the reason we say such a sharp increase in price is that home sales were actually very strong at the high end of the market, where there are more homes for sale.
Sales of homes in the US priced below $100,000 were down 15% annually in December, while sales of homes priced between $500,000 and $750,000 were up 65% year over year, and sales of million-dollar-plus homes were up by a whopping 94% from a year ago.
A lot of the growth in the luxury market can also be attributed to mortgage rates with jumbo rates – that spiked with the pandemic – dropping significantly and this has led sales higher.
Breaking out the single-family market from condos, sales leapt in the early summer but leveled off in the fall because of – you guessed it – a lack of homes for sale and not a lack of demand.
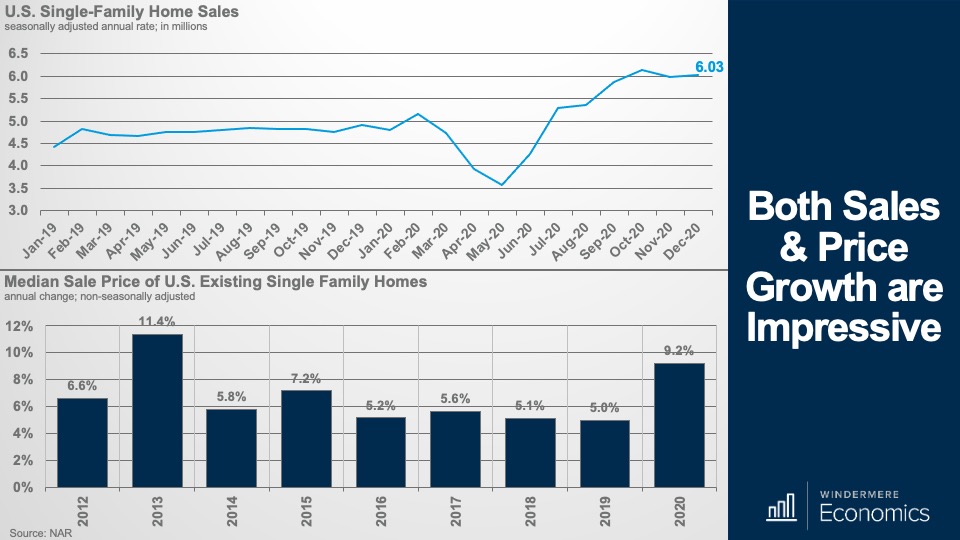
In 2020, sales of single-family homes rose by 6.3% – a massive number that’s even more impressive given the fact that sales only rose by 0.5% in 2019.
And prices were, naturally on the rise too – increasing by 9.2% last year, and that’s the fastest rate we have seen since 2013, and that was when we were starting to recover from the housing bubble that burst causing home prices to collapse value buyers jumped in causing prices to rise significantly.
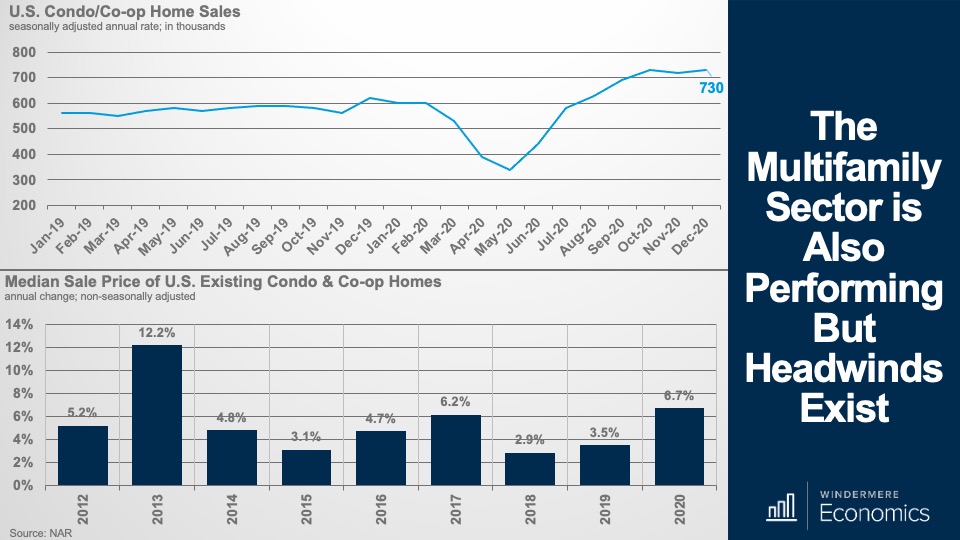
Looking now at condos, we see a somewhat similar picture with the annual rate of sales coming in at over 700,000 units but, interestingly, 2020 total condo sales were actually 0.3% lower than we saw in 2019.
What is happening here is a drop in demand for urban multifamily units with buyers able to work remotely. And this is also reflected by lower price growth than we saw in the single-family market.
As we move forward, I am still positive about the multifamily arena, but we are already seeing softening in demand and price in some market across the nation and here I am directly referring to San Francisco here in the West, and New York and Boston back East.
In as much as we will continuing to see short-term demand and price issues in many urban markets, it doesn’t mean that the overall condo market is going to collapse.
In fact, I think that once we get back to “normal” we may well see demand increase again and, if we see prices start to drop, I expect demand to rise even further as buyers who had previously been priced out of many of these large cities see that they can now afford to buy.
So, there you have it. My take on the January housing related data releases.
As always, if you have any questions or comments about the topics I have discussed today, feel free to reach out – I am only an e-mail away!
In the meantime, thank you for watching, stay safe out there, and I look forward to visiting with you again, next month.
Water is constantly coursing through your home, flowing in and out of drain pipes, sinks, tubs, and showers. Numerous systems in our homes are dependent upon water, but the minute it runs rampant it begins to cause damage. The consequences of water damage run the gamut, from rotted drywall and mold growth to serious structural issues. The following guide will help you understand what you can do to prevent water damage in your home.
How to Prevent Water Damage
Leaks
Leaks soften wood, which invites all sorts of unwanted activity from termites, while simultaneously creating a perfect habitat for mold and mildew growth. To prevent leaks, keep your drains healthy by frequently cleaning out your drain strainers and refraining from dumping grease down your drains. Check to make sure none of your drains are leaking and if need be, repair or replace your p-traps. Drips, dark stains around your pipes, and discoloration on your ceilings and walls are all strong indicators that a leak has sprung. If you notice an inexplicable spike in your water bill, this is also a sign of a potential leak. By identifying these signs, you can begin repairs right away and stop the water damage in its tracks.
Gutter drainage
A home with weak gutter drainage is an open invitation for water damage to occur. Cleaning your gutters routinely is the best way to prevent them from clogging, which helps to avoid damage to your siding and foundation. Make sure your downspouts expel the gutter water away from your house parallel to the ground. Take a trip to the hardware store for downspout extensions and elbows to make sure that water won’t build up around your home’s foundation, especially if you live in a rainy climate.
Sump pump
Your sump pump can be your saving grace should a water emergency occur. Sump pumps move excess groundwater away from your home, preventing it from infiltrating your basement or crawl space. They are connected to the Ground Fault Circuit Interrupter (GFCI) electrical outlet, which protects it from electrical shorts. There are two ways to test your sump pump. The first is by pouring in enough water to raise the float. If it’s working properly, the pump should activate and begin removing water from its pit. The other method is to unplug the pump’s power and plug it back in. If it does not turn on, it requires repair or replacement.
More
There are some additional steps you can take to prevent water damage to your home. Inspect your roof to identify any damaged shingles or cracks. While you’re up on the roof, take a look at your chimney. Repair any cracked or broken bricks and consider a chimney cap if you don’t already have one in place.
Water damage can be harmful to your home and your finances. Even the smallest leak can snowball into larger problems if neglected. By following the steps to prevent water damage, you’ll know if your home needs repairs before it’s too late. For more advice on preventing damage to your home, read our guides to wildfire and winter storm prevention.

 Facebook
 X
X
 Pinterest
 Copy Link


 Regional Housing Market News